
ノボジーン
  • ノボジーン
  • ゲノミクス
    • ヒト全ゲノムシーケンス
    • 動植物全ゲノムシーケンス
    • 微生物全ゲノムシーケンス
    • 動植物de novoシーケンス
    • 微生物de novoシーケンス
    • ショットガンメタゲノムシーケンス
    • アンプリコンシーケンス
    • 全エクソームシーケンス
    トランスクリプトミクス
    • mRNAシーケンス
    • トータルRNAシーケンス
    • 全長トランスクリプトームシーケンス
    • 全トランスクリプトームシーケンス
    • スモールRNAシーケンシング
    • 環状RNAシーケンス
    • メタトランスクリプトームシーケンス
    • 原核生物RNAシーケンス
    シングルセルと空間オミクス
    • シングルセル遺伝子発現解析
    • シングルセル免疫プロファイリングシーケンス
    • シングルセルロングリードトランスクリプトーム
    エピゲノミクス
    • 全ゲノムバイサルファイトシーケンス(WGBS)
    • ディレクトDNAメチレーションシーケンス(DM-Seq)new
    • 還元型バイサルファイトシーケンス (RRBS)
    • クロマチン免疫沈降シーケンス(ChIP-Seq)
    • RNA免疫沈降シーケンス (RIP-Seq)

    相乗りシーケンス

    • 相乗りシーケンス(イルミナプラットフォーム)
    • 相乗りシーケンス(PacBioプラットフォーム)
    プロテオミクス & メタボロミクス
    • Olinkプロテオミクス
  • プロモーションプロモーション
    • プラットフォーム
    • インテリジェント自動化プラットフォーム(Falcon)
    • バイオインフォマティクス解析ツール(NovoMagic)
    • カスタマサービスシステム(CSS)
    • パンフレット
    • ケーススタディ
    • ウェビナー
    • ブログ
    • サンプルガイドライン
    • コンミュニティ
    • がん研究
    • がん免疫
    • アグリゲノミクス
    • 環境
    • 食品科学
    • ヒトマイクロバイオーム
    • 植物および動物マイクロバイオーム
    • 創薬および開発
    • 希少および複雑性疾患
    • ノボジーンについて
    • 拠点一覧
    • ニュース
    • キャリア
  • お問い合わせお問い合わせ

サービスサービス menu

サポートサポート menu

会社会社 menu

サービス
全ゲノムシーケンスde novoシーケンスアンプリコンシーケンスショットガンメタゲノムシーケンスディレクトDNAメチレーションシーケンス(DM-Seq)mRNAシーケンスシングルセル遺伝子発現解析Olinkプロテオミクス
サポート
バイオインフォマティクス解析ツール(NovoMagic)カスタマサービスシステム(CSS)インテリジェント自動化プラットフォーム(Falcon)
会社
ノボジーンについて拠点一覧プラットフォームニュースキャリアお問い合わせ
YouTubeYouTube hoverXX hover
Copyright © 2026 Novogene Inc. All rights reserved. 本サービスは研究目的のみにご利用ください。臨床診断目的には使用頂けません。
ノボジーン
  • ノボジーン
  • ゲノミクス
    • ヒト全ゲノムシーケンス
    • 動植物全ゲノムシーケンス
    • 微生物全ゲノムシーケンス
    • 動植物de novoシーケンス
    • 微生物de novoシーケンス
    • ショットガンメタゲノムシーケンス
    • アンプリコンシーケンス
    • 全エクソームシーケンス
    トランスクリプトミクス
    • mRNAシーケンス
    • トータルRNAシーケンス
    • 全長トランスクリプトームシーケンス
    • 全トランスクリプトームシーケンス
    • スモールRNAシーケンシング
    • 環状RNAシーケンス
    • メタトランスクリプトームシーケンス
    • 原核生物RNAシーケンス
    シングルセルと空間オミクス
    • シングルセル遺伝子発現解析
    • シングルセル免疫プロファイリングシーケンス
    • シングルセルロングリードトランスクリプトーム
    エピゲノミクス
    • 全ゲノムバイサルファイトシーケンス(WGBS)
    • ディレクトDNAメチレーションシーケンス(DM-Seq)new
    • 還元型バイサルファイトシーケンス (RRBS)
    • クロマチン免疫沈降シーケンス(ChIP-Seq)
    • RNA免疫沈降シーケンス (RIP-Seq)

    相乗りシーケンス

    • 相乗りシーケンス(イルミナプラットフォーム)
    • 相乗りシーケンス(PacBioプラットフォーム)
    プロテオミクス & メタボロミクス
    • Olinkプロテオミクス
  • プロモーションプロモーション
    • プラットフォーム
    • インテリジェント自動化プラットフォーム(Falcon)
    • バイオインフォマティクス解析ツール(NovoMagic)
    • カスタマサービスシステム(CSS)
    • パンフレット
    • ケーススタディ
    • ウェビナー
    • ブログ
    • サンプルガイドライン
    • コンミュニティ
    • がん研究
    • がん免疫
    • アグリゲノミクス
    • 環境
    • 食品科学
    • ヒトマイクロバイオーム
    • 植物および動物マイクロバイオーム
    • 創薬および開発
    • 希少および複雑性疾患
    • ノボジーンについて
    • 拠点一覧
    • ニュース
    • キャリア
  • お問い合わせお問い合わせ

サービスサービス menu

サポートサポート menu

会社会社 menu

サービス
全ゲノムシーケンスde novoシーケンスアンプリコンシーケンスショットガンメタゲノムシーケンスディレクトDNAメチレーションシーケンス(DM-Seq)mRNAシーケンスシングルセル遺伝子発現解析Olinkプロテオミクス
サポート
バイオインフォマティクス解析ツール(NovoMagic)カスタマサービスシステム(CSS)インテリジェント自動化プラットフォーム(Falcon)
会社
ノボジーンについて拠点一覧プラットフォームニュースキャリアお問い合わせ
YouTubeYouTube hoverXX hover
Copyright © 2026 Novogene Inc. All rights reserved. 本サービスは研究目的のみにご利用ください。臨床診断目的には使用頂けません。
banner laptop bg
banner mobile bg

シングルセル免疫プロファイリングシーケンス (10x 免疫プロファイリング)

ご相談ください
(シングルセル免疫プロファイリングシーケンス (10x 免疫プロファイリング))
ご相談ください
(シングルセル免疫プロファイリングシーケンス (10x 免疫プロファイリング))
概要概要
利点利点
アプリケーションアプリケーション
仕様仕様
リソースリソース

5′ GEXは、完全な免疫細胞および非免疫細胞における転写の不均一生を捉え、細胞タイプ、活性化状態、機能プログラムの同定を促進します。この10x scRNA-seqベースのシングルセルRNA-seqアプローチは、複雑な免疫集団全体にわたる高解像度のシングルセル遺伝子発現データを生成します。T細胞受容体(TCR)およびB細胞受容体(BCR)シーケンスと組み合わせることで、本プラットフォームは遺伝子発現と免疫クローナリティの同時解析を可能にし、クローン拡大と免疫細胞表現型に関する知見を提供します。


ノボジーンの5' GEX および免疫プロファイリング ソリューションは、最新の10x Genomics Chromium iX プラットフォームと GEM-X 化学ベースのユニバーサル 5' 遺伝子発現アッセイによって強化されていて、高感度・再現性・信頼性の高い性能を実現しています。ノボジーンの合理化されたエンドツーエンドワークフローには、サンプル処理と品質管理、シングルセルライブラリ調製、NovaSeq X Plusによるハイスループットシーケンス、包括的なバイオインフォマティクス解析が含まれます。また、直感的なデータ解釈をサポートし生物学的発見を加速させるため、論文化可能な明確な可視化データを提供します。

なぜノボジーンが5' GEXと免疫プロファイリングに選ばれるのか

エンドツーエンドサービス
エンドツーエンドサービス

サンプル処理(新鮮組織の分離、核の分離)とQC、シングルセルライブラリ調製、シーケンス、そして「論文掲載可能な」図表付きバイオインフォマティクス解析を含みます。

エンドツーエンドサービス
エンドツーエンドサービス

サンプル処理(新鮮組織の分離、核の分離)とQC、シングルセルライブラリ調製、シーケンス、そして「論文掲載可能な」図表付きバイオインフォマティクス解析を含みます。

高品質データ
高品質データ

QC基準を通過したサンプルに対し、データ出力保証と業界トップクラスの基準を満たす高品質シーケンスデータを提供します。

高品質データ
高品質データ

QC基準を通過したサンプルに対し、データ出力保証と業界トップクラスの基準を満たす高品質シーケンスデータを提供します。

バイオインフォマティクスサポート
バイオインフォマティクスサポート

バイオインフォマティクスサポート:研究者が生物学的データから深い知見を得られるよう、包括的なバイオインフォマティクスサポートを提供します。分野の最新解析アルゴリズムを用いた標準パイプラインからカスタマイズソリューションまで対応しています。

バイオインフォマティクスサポート
バイオインフォマティクスサポート

バイオインフォマティクスサポート:研究者が生物学的データから深い知見を得られるよう、包括的なバイオインフォマティクスサポートを提供します。分野の最新解析アルゴリズムを用いた標準パイプラインからカスタマイズソリューションまで対応しています。

最新テクノロジー
最新テクノロジー

10x Genomics社の最新Chromium iXおよびGEM-Xケミストリーを活用し、免疫プロファイリング付き最先端scRNA-seqサービスを提供します。

最新テクノロジー
最新テクノロジー

10x Genomics社の最新Chromium iXおよびGEM-Xケミストリーを活用し、免疫プロファイリング付き最先端scRNA-seqサービスを提供します。

費用対効果の高いソリューション
費用対効果の高いソリューション

ノボジーンは最先端のハイスループット シーケンス プラットフォームを備えており、専門家によるサポートと組み合わせることで、優れたデータ品質を保証し、シングルセルプロジェクトに費用対効果の高いソリューションを提供します。

費用対効果の高いソリューション
費用対効果の高いソリューション

ノボジーンは最先端のハイスループット シーケンス プラットフォームを備えており、専門家によるサポートと組み合わせることで、優れたデータ品質を保証し、シングルセルプロジェクトに費用対効果の高いソリューションを提供します。

なぜノボジーンが5' GEXと免疫プロファイリングに選ばれるのか

エンドツーエンドサービス
エンドツーエンドサービス

サンプル処理(新鮮組織の分離、核の分離)とQC、シングルセルライブラリ調製、シーケンス、そして「論文掲載可能な」図表付きバイオインフォマティクス解析を含みます。

エンドツーエンドサービス
エンドツーエンドサービス

サンプル処理(新鮮組織の分離、核の分離)とQC、シングルセルライブラリ調製、シーケンス、そして「論文掲載可能な」図表付きバイオインフォマティクス解析を含みます。

高品質データ
高品質データ

QC基準を通過したサンプルに対し、データ出力保証と業界トップクラスの基準を満たす高品質シーケンスデータを提供します。

高品質データ
高品質データ

QC基準を通過したサンプルに対し、データ出力保証と業界トップクラスの基準を満たす高品質シーケンスデータを提供します。

バイオインフォマティクスサポート
バイオインフォマティクスサポート

バイオインフォマティクスサポート:研究者が生物学的データから深い知見を得られるよう、包括的なバイオインフォマティクスサポートを提供します。分野の最新解析アルゴリズムを用いた標準パイプラインからカスタマイズソリューションまで対応しています。

バイオインフォマティクスサポート
バイオインフォマティクスサポート

バイオインフォマティクスサポート:研究者が生物学的データから深い知見を得られるよう、包括的なバイオインフォマティクスサポートを提供します。分野の最新解析アルゴリズムを用いた標準パイプラインからカスタマイズソリューションまで対応しています。

最新テクノロジー
最新テクノロジー

10x Genomics社の最新Chromium iXおよびGEM-Xケミストリーを活用し、免疫プロファイリング付き最先端scRNA-seqサービスを提供します。

最新テクノロジー
最新テクノロジー

10x Genomics社の最新Chromium iXおよびGEM-Xケミストリーを活用し、免疫プロファイリング付き最先端scRNA-seqサービスを提供します。

費用対効果の高いソリューション
費用対効果の高いソリューション

ノボジーンは最先端のハイスループット シーケンス プラットフォームを備えており、専門家によるサポートと組み合わせることで、優れたデータ品質を保証し、シングルセルプロジェクトに費用対効果の高いソリューションを提供します。

費用対効果の高いソリューション
費用対効果の高いソリューション

ノボジーンは最先端のハイスループット シーケンス プラットフォームを備えており、専門家によるサポートと組み合わせることで、優れたデータ品質を保証し、シングルセルプロジェクトに費用対効果の高いソリューションを提供します。

研究と医療における10×免疫プロファイリングの応用

10×免疫プロファイリングは、以下の研究領域における免疫多様性の解析をサポートしています:

腫瘍微小環境

腫瘍免疫微小環境の特徴と免疫療法の反応メカニズムを解明

腫瘍微小環境

腫瘍免疫微小環境の特徴と免疫療法の反応メカニズムを解明

感染症

病原体特異的クローンの解析による感染メカニズムの解明と抗ウイルス療法のエビデンス提供

感染症

病原体特異的クローンの解析による感染メカニズムの解明と抗ウイルス療法のエビデンス提供

自己免疫疾患

免疫レパトアのクローン進化を追跡し、異常増殖したT細胞/B細胞サブポピュレーションを同定、疾患サブタイピングと標的発見を支援

自己免疫疾患

免疫レパトアのクローン進化を追跡し、異常増殖したT細胞/B細胞サブポピュレーションを同定、疾患サブタイピングと標的発見を支援

ワクチン候補スクリーニング

特異的TCR/BCRの迅速スクリーニングによるワクチン候補の検証加速

ワクチン候補スクリーニング

特異的TCR/BCRの迅速スクリーニングによるワクチン候補の検証加速

研究と医療における10×免疫プロファイリングの応用

10×免疫プロファイリングは、以下の研究領域における免疫多様性の解析をサポートしています:

腫瘍微小環境

腫瘍免疫微小環境の特徴と免疫療法の反応メカニズムを解明

腫瘍微小環境

腫瘍免疫微小環境の特徴と免疫療法の反応メカニズムを解明

感染症

病原体特異的クローンの解析による感染メカニズムの解明と抗ウイルス療法のエビデンス提供

感染症

病原体特異的クローンの解析による感染メカニズムの解明と抗ウイルス療法のエビデンス提供

自己免疫疾患

免疫レパトアのクローン進化を追跡し、異常増殖したT細胞/B細胞サブポピュレーションを同定、疾患サブタイピングと標的発見を支援

自己免疫疾患

免疫レパトアのクローン進化を追跡し、異常増殖したT細胞/B細胞サブポピュレーションを同定、疾患サブタイピングと標的発見を支援

ワクチン候補スクリーニング

特異的TCR/BCRの迅速スクリーニングによるワクチン候補の検証加速

ワクチン候補スクリーニング

特異的TCR/BCRの迅速スクリーニングによるワクチン候補の検証加速

仕様

サンプル要件

サンプル量は参考値です。以下をダウンロードしてご確認ください。詳細については、サンプル要件をダウンロードしてご確認ください。カスタマイズされたご要望については、お問い合わせください 。

サービスサンプル種*サンプルタイプサンプル量輸送条件
5' GEX + TCR/BCRHuman/MouseFresh single cell suspensionRecommended Amount: > 1,000,000 cells per sample;Needs to be shipped with ice packs within 2hrs
Frozen single cell suspensionRecommended Amount: > 1,000,000 cells per sample;Ship with sufficient dry ice
Fresh tissueTissue weight ≥ 200mg
(minimum ≥ 100mg)
≥ 2 tissue pieces/sample, separate 1.5ml cryovials
Needs to be shipped with ice packs within 48hrs of harvest

サンプル要件

サンプル量は参考値です。以下をダウンロードしてご確認ください。詳細については、サンプル要件をダウンロードしてご確認ください。カスタマイズされたご要望については、お問い合わせください 。

サービスサンプル種*サンプルタイプサンプル量輸送条件
5' GEX + TCR/BCRHuman/MouseFresh single cell suspensionRecommended Amount: > 1,000,000 cells per sample;Needs to be shipped with ice packs within 2hrs
Frozen single cell suspensionRecommended Amount: > 1,000,000 cells per sample;Ship with sufficient dry ice
Fresh tissueTissue weight ≥ 200mg
(minimum ≥ 100mg)
≥ 2 tissue pieces/sample, separate 1.5ml cryovials
Needs to be shipped with ice packs within 48hrs of harvest

サンプル要件

サンプル量は参考値です。以下をダウンロードしてご確認ください。詳細については、サンプル要件をダウンロードしてご確認ください。カスタマイズされたご要望については、お問い合わせください 。

サービスサンプル種*サンプルタイプサンプル量輸送条件
5' GEX + TCR/BCRHuman/MouseFresh single cell suspensionRecommended Amount: > 1,000,000 cells per sample;Needs to be shipped with ice packs within 2hrs
Frozen single cell suspensionRecommended Amount: > 1,000,000 cells per sample;Ship with sufficient dry ice
Fresh tissueTissue weight ≥ 200mg
(minimum ≥ 100mg)
≥ 2 tissue pieces/sample, separate 1.5ml cryovials
Needs to be shipped with ice packs within 48hrs of harvest

サンプル要件

サンプル量は参考値です。以下をダウンロードしてご確認ください。詳細については、サンプル要件をダウンロードしてご確認ください。カスタマイズされたご要望については、お問い合わせください 。

サービスサンプル種*サンプルタイプサンプル量輸送条件
5' GEX + TCR/BCRHuman/MouseFresh single cell suspensionRecommended Amount: > 1,000,000 cells per sample;Needs to be shipped with ice packs within 2hrs
Frozen single cell suspensionRecommended Amount: > 1,000,000 cells per sample;Ship with sufficient dry ice
Fresh tissueTissue weight ≥ 200mg
(minimum ≥ 100mg)
≥ 2 tissue pieces/sample, separate 1.5ml cryovials
Needs to be shipped with ice packs within 48hrs of harvest

シーケンスおよび解析

表示されている推奨データ量および解析内容は参考値です。カスタマイズされたご要望については、 お問い合わせください 。

シーケンス
プラットフォーム
Illumina NovaSeq X-Plus Sequencing Platform
Read LengthPaired-end 150 bp
Recommended DataMinimum 20,000 read pairs/cell for gene expression; 5,000 read pairs/cell for V(D)J
AnalysisCell Ranger Analysis (Gene Expression)

Demultiplex BCL files from a sequencer into FASTQs.
Summary metrics (sequencing quality, number of cells detected, the mean reads per cell, and the median genes detected per cell et al.).
Alignment of reads to genome.
Gene expression quantification.
Clustering analysis.
Differentially expression analysis between clusters.
Visualization.
Standard Analysis (Gene Expression)

Demultiplex BCL files from a sequencer into FASTQs.
Alignment, UMI counting, Metrics summary.
Identification of highly variable gene (HVGs).
Cell Subpopulation Identification.
Principal component analysis (PCA).
Identify clusters of cells.
Dimensionality reduction and Visualization.
Marker gene detection (Differentially expression analysis between clusters).
GO/KEGG/Reactome Enrichment.
FunctionalAnnotation of Transcription Factor.
Protein-Protein Interaction Network Analysis.
Standard Analysis (V(D)J)

Demultiplex BCL files from a sequencer into FASTQs.
Construction of Immune Repertoire(Alignment,Assembling contigs,Annotating contigs,
Cell identification,Generating clonotype)
Cell Filtration
Clonotypes Statistics
CDR3 Length Statistics
Display of VJ Gene Abundance for Each Sample
Clonotypes for Displaying VJ Gene Combinations
Analysis of Highly Expressed Clonotypes by Multi-Sample Comparison
Clone Proportion Analysis
Clonal Diversity Analysis

シーケンスおよび解析

表示されている推奨データ量および解析内容は参考値です。カスタマイズされたご要望については、 お問い合わせください 。

シーケンス
プラットフォーム
Illumina NovaSeq X-Plus Sequencing Platform
Read LengthPaired-end 150 bp
Recommended DataMinimum 20,000 read pairs/cell for gene expression; 5,000 read pairs/cell for V(D)J
AnalysisCell Ranger Analysis (Gene Expression)

Demultiplex BCL files from a sequencer into FASTQs.
Summary metrics (sequencing quality, number of cells detected, the mean reads per cell, and the median genes detected per cell et al.).
Alignment of reads to genome.
Gene expression quantification.
Clustering analysis.
Differentially expression analysis between clusters.
Visualization.
Standard Analysis (Gene Expression)

Demultiplex BCL files from a sequencer into FASTQs.
Alignment, UMI counting, Metrics summary.
Identification of highly variable gene (HVGs).
Cell Subpopulation Identification.
Principal component analysis (PCA).
Identify clusters of cells.
Dimensionality reduction and Visualization.
Marker gene detection (Differentially expression analysis between clusters).
GO/KEGG/Reactome Enrichment.
FunctionalAnnotation of Transcription Factor.
Protein-Protein Interaction Network Analysis.
Standard Analysis (V(D)J)

Demultiplex BCL files from a sequencer into FASTQs.
Construction of Immune Repertoire(Alignment,Assembling contigs,Annotating contigs,
Cell identification,Generating clonotype)
Cell Filtration
Clonotypes Statistics
CDR3 Length Statistics
Display of VJ Gene Abundance for Each Sample
Clonotypes for Displaying VJ Gene Combinations
Analysis of Highly Expressed Clonotypes by Multi-Sample Comparison
Clone Proportion Analysis
Clonal Diversity Analysis

シーケンスおよび解析

表示されている推奨データ量および解析内容は参考値です。カスタマイズされたご要望については、 お問い合わせください 。

シーケンス
プラットフォーム
Illumina NovaSeq X-Plus Sequencing Platform
Read LengthPaired-end 150 bp
Recommended DataMinimum 20,000 read pairs/cell for gene expression; 5,000 read pairs/cell for V(D)J
AnalysisCell Ranger Analysis (Gene Expression)

Demultiplex BCL files from a sequencer into FASTQs.
Summary metrics (sequencing quality, number of cells detected, the mean reads per cell, and the median genes detected per cell et al.).
Alignment of reads to genome.
Gene expression quantification.
Clustering analysis.
Differentially expression analysis between clusters.
Visualization.
Standard Analysis (Gene Expression)

Demultiplex BCL files from a sequencer into FASTQs.
Alignment, UMI counting, Metrics summary.
Identification of highly variable gene (HVGs).
Cell Subpopulation Identification.
Principal component analysis (PCA).
Identify clusters of cells.
Dimensionality reduction and Visualization.
Marker gene detection (Differentially expression analysis between clusters).
GO/KEGG/Reactome Enrichment.
FunctionalAnnotation of Transcription Factor.
Protein-Protein Interaction Network Analysis.
Standard Analysis (V(D)J)

Demultiplex BCL files from a sequencer into FASTQs.
Construction of Immune Repertoire(Alignment,Assembling contigs,Annotating contigs,
Cell identification,Generating clonotype)
Cell Filtration
Clonotypes Statistics
CDR3 Length Statistics
Display of VJ Gene Abundance for Each Sample
Clonotypes for Displaying VJ Gene Combinations
Analysis of Highly Expressed Clonotypes by Multi-Sample Comparison
Clone Proportion Analysis
Clonal Diversity Analysis

シーケンスおよび解析

表示されている推奨データ量および解析内容は参考値です。カスタマイズされたご要望については、 お問い合わせください 。

シーケンス
プラットフォーム
Illumina NovaSeq X-Plus Sequencing Platform
Read LengthPaired-end 150 bp
Recommended DataMinimum 20,000 read pairs/cell for gene expression; 5,000 read pairs/cell for V(D)J
AnalysisCell Ranger Analysis (Gene Expression)

Demultiplex BCL files from a sequencer into FASTQs.
Summary metrics (sequencing quality, number of cells detected, the mean reads per cell, and the median genes detected per cell et al.).
Alignment of reads to genome.
Gene expression quantification.
Clustering analysis.
Differentially expression analysis between clusters.
Visualization.
Standard Analysis (Gene Expression)

Demultiplex BCL files from a sequencer into FASTQs.
Alignment, UMI counting, Metrics summary.
Identification of highly variable gene (HVGs).
Cell Subpopulation Identification.
Principal component analysis (PCA).
Identify clusters of cells.
Dimensionality reduction and Visualization.
Marker gene detection (Differentially expression analysis between clusters).
GO/KEGG/Reactome Enrichment.
FunctionalAnnotation of Transcription Factor.
Protein-Protein Interaction Network Analysis.
Standard Analysis (V(D)J)

Demultiplex BCL files from a sequencer into FASTQs.
Construction of Immune Repertoire(Alignment,Assembling contigs,Annotating contigs,
Cell identification,Generating clonotype)
Cell Filtration
Clonotypes Statistics
CDR3 Length Statistics
Display of VJ Gene Abundance for Each Sample
Clonotypes for Displaying VJ Gene Combinations
Analysis of Highly Expressed Clonotypes by Multi-Sample Comparison
Clone Proportion Analysis
Clonal Diversity Analysis

仕様

サンプル要件

サンプル量は参考値です。以下をダウンロードしてご確認ください。詳細については、サンプル要件をダウンロードしてご確認ください。カスタマイズされたご要望については、お問い合わせください 。

サービスサンプル種*サンプルタイプサンプル量輸送条件
5' GEX + TCR/BCRHuman/MouseFresh single cell suspensionRecommended Amount: > 1,000,000 cells per sample;Needs to be shipped with ice packs within 2hrs
Frozen single cell suspensionRecommended Amount: > 1,000,000 cells per sample;Ship with sufficient dry ice
Fresh tissueTissue weight ≥ 200mg
(minimum ≥ 100mg)
≥ 2 tissue pieces/sample, separate 1.5ml cryovials
Needs to be shipped with ice packs within 48hrs of harvest

サンプル要件

サンプル量は参考値です。以下をダウンロードしてご確認ください。詳細については、サンプル要件をダウンロードしてご確認ください。カスタマイズされたご要望については、お問い合わせください 。

サービスサンプル種*サンプルタイプサンプル量輸送条件
5' GEX + TCR/BCRHuman/MouseFresh single cell suspensionRecommended Amount: > 1,000,000 cells per sample;Needs to be shipped with ice packs within 2hrs
Frozen single cell suspensionRecommended Amount: > 1,000,000 cells per sample;Ship with sufficient dry ice
Fresh tissueTissue weight ≥ 200mg
(minimum ≥ 100mg)
≥ 2 tissue pieces/sample, separate 1.5ml cryovials
Needs to be shipped with ice packs within 48hrs of harvest

サンプル要件

サンプル量は参考値です。以下をダウンロードしてご確認ください。詳細については、サンプル要件をダウンロードしてご確認ください。カスタマイズされたご要望については、お問い合わせください 。

サービスサンプル種*サンプルタイプサンプル量輸送条件
5' GEX + TCR/BCRHuman/MouseFresh single cell suspensionRecommended Amount: > 1,000,000 cells per sample;Needs to be shipped with ice packs within 2hrs
Frozen single cell suspensionRecommended Amount: > 1,000,000 cells per sample;Ship with sufficient dry ice
Fresh tissueTissue weight ≥ 200mg
(minimum ≥ 100mg)
≥ 2 tissue pieces/sample, separate 1.5ml cryovials
Needs to be shipped with ice packs within 48hrs of harvest

サンプル要件

サンプル量は参考値です。以下をダウンロードしてご確認ください。詳細については、サンプル要件をダウンロードしてご確認ください。カスタマイズされたご要望については、お問い合わせください 。

サービスサンプル種*サンプルタイプサンプル量輸送条件
5' GEX + TCR/BCRHuman/MouseFresh single cell suspensionRecommended Amount: > 1,000,000 cells per sample;Needs to be shipped with ice packs within 2hrs
Frozen single cell suspensionRecommended Amount: > 1,000,000 cells per sample;Ship with sufficient dry ice
Fresh tissueTissue weight ≥ 200mg
(minimum ≥ 100mg)
≥ 2 tissue pieces/sample, separate 1.5ml cryovials
Needs to be shipped with ice packs within 48hrs of harvest

シーケンスおよび解析

表示されている推奨データ量および解析内容は参考値です。カスタマイズされたご要望については、 お問い合わせください 。

シーケンス
プラットフォーム
Illumina NovaSeq X-Plus Sequencing Platform
Read LengthPaired-end 150 bp
Recommended DataMinimum 20,000 read pairs/cell for gene expression; 5,000 read pairs/cell for V(D)J
AnalysisCell Ranger Analysis (Gene Expression)

Demultiplex BCL files from a sequencer into FASTQs.
Summary metrics (sequencing quality, number of cells detected, the mean reads per cell, and the median genes detected per cell et al.).
Alignment of reads to genome.
Gene expression quantification.
Clustering analysis.
Differentially expression analysis between clusters.
Visualization.
Standard Analysis (Gene Expression)

Demultiplex BCL files from a sequencer into FASTQs.
Alignment, UMI counting, Metrics summary.
Identification of highly variable gene (HVGs).
Cell Subpopulation Identification.
Principal component analysis (PCA).
Identify clusters of cells.
Dimensionality reduction and Visualization.
Marker gene detection (Differentially expression analysis between clusters).
GO/KEGG/Reactome Enrichment.
FunctionalAnnotation of Transcription Factor.
Protein-Protein Interaction Network Analysis.
Standard Analysis (V(D)J)

Demultiplex BCL files from a sequencer into FASTQs.
Construction of Immune Repertoire(Alignment,Assembling contigs,Annotating contigs,
Cell identification,Generating clonotype)
Cell Filtration
Clonotypes Statistics
CDR3 Length Statistics
Display of VJ Gene Abundance for Each Sample
Clonotypes for Displaying VJ Gene Combinations
Analysis of Highly Expressed Clonotypes by Multi-Sample Comparison
Clone Proportion Analysis
Clonal Diversity Analysis

シーケンスおよび解析

表示されている推奨データ量および解析内容は参考値です。カスタマイズされたご要望については、 お問い合わせください 。

シーケンス
プラットフォーム
Illumina NovaSeq X-Plus Sequencing Platform
Read LengthPaired-end 150 bp
Recommended DataMinimum 20,000 read pairs/cell for gene expression; 5,000 read pairs/cell for V(D)J
AnalysisCell Ranger Analysis (Gene Expression)

Demultiplex BCL files from a sequencer into FASTQs.
Summary metrics (sequencing quality, number of cells detected, the mean reads per cell, and the median genes detected per cell et al.).
Alignment of reads to genome.
Gene expression quantification.
Clustering analysis.
Differentially expression analysis between clusters.
Visualization.
Standard Analysis (Gene Expression)

Demultiplex BCL files from a sequencer into FASTQs.
Alignment, UMI counting, Metrics summary.
Identification of highly variable gene (HVGs).
Cell Subpopulation Identification.
Principal component analysis (PCA).
Identify clusters of cells.
Dimensionality reduction and Visualization.
Marker gene detection (Differentially expression analysis between clusters).
GO/KEGG/Reactome Enrichment.
FunctionalAnnotation of Transcription Factor.
Protein-Protein Interaction Network Analysis.
Standard Analysis (V(D)J)

Demultiplex BCL files from a sequencer into FASTQs.
Construction of Immune Repertoire(Alignment,Assembling contigs,Annotating contigs,
Cell identification,Generating clonotype)
Cell Filtration
Clonotypes Statistics
CDR3 Length Statistics
Display of VJ Gene Abundance for Each Sample
Clonotypes for Displaying VJ Gene Combinations
Analysis of Highly Expressed Clonotypes by Multi-Sample Comparison
Clone Proportion Analysis
Clonal Diversity Analysis

シーケンスおよび解析

表示されている推奨データ量および解析内容は参考値です。カスタマイズされたご要望については、 お問い合わせください 。

シーケンス
プラットフォーム
Illumina NovaSeq X-Plus Sequencing Platform
Read LengthPaired-end 150 bp
Recommended DataMinimum 20,000 read pairs/cell for gene expression; 5,000 read pairs/cell for V(D)J
AnalysisCell Ranger Analysis (Gene Expression)

Demultiplex BCL files from a sequencer into FASTQs.
Summary metrics (sequencing quality, number of cells detected, the mean reads per cell, and the median genes detected per cell et al.).
Alignment of reads to genome.
Gene expression quantification.
Clustering analysis.
Differentially expression analysis between clusters.
Visualization.
Standard Analysis (Gene Expression)

Demultiplex BCL files from a sequencer into FASTQs.
Alignment, UMI counting, Metrics summary.
Identification of highly variable gene (HVGs).
Cell Subpopulation Identification.
Principal component analysis (PCA).
Identify clusters of cells.
Dimensionality reduction and Visualization.
Marker gene detection (Differentially expression analysis between clusters).
GO/KEGG/Reactome Enrichment.
FunctionalAnnotation of Transcription Factor.
Protein-Protein Interaction Network Analysis.
Standard Analysis (V(D)J)

Demultiplex BCL files from a sequencer into FASTQs.
Construction of Immune Repertoire(Alignment,Assembling contigs,Annotating contigs,
Cell identification,Generating clonotype)
Cell Filtration
Clonotypes Statistics
CDR3 Length Statistics
Display of VJ Gene Abundance for Each Sample
Clonotypes for Displaying VJ Gene Combinations
Analysis of Highly Expressed Clonotypes by Multi-Sample Comparison
Clone Proportion Analysis
Clonal Diversity Analysis

シーケンスおよび解析

表示されている推奨データ量および解析内容は参考値です。カスタマイズされたご要望については、 お問い合わせください 。

シーケンス
プラットフォーム
Illumina NovaSeq X-Plus Sequencing Platform
Read LengthPaired-end 150 bp
Recommended DataMinimum 20,000 read pairs/cell for gene expression; 5,000 read pairs/cell for V(D)J
AnalysisCell Ranger Analysis (Gene Expression)

Demultiplex BCL files from a sequencer into FASTQs.
Summary metrics (sequencing quality, number of cells detected, the mean reads per cell, and the median genes detected per cell et al.).
Alignment of reads to genome.
Gene expression quantification.
Clustering analysis.
Differentially expression analysis between clusters.
Visualization.
Standard Analysis (Gene Expression)

Demultiplex BCL files from a sequencer into FASTQs.
Alignment, UMI counting, Metrics summary.
Identification of highly variable gene (HVGs).
Cell Subpopulation Identification.
Principal component analysis (PCA).
Identify clusters of cells.
Dimensionality reduction and Visualization.
Marker gene detection (Differentially expression analysis between clusters).
GO/KEGG/Reactome Enrichment.
FunctionalAnnotation of Transcription Factor.
Protein-Protein Interaction Network Analysis.
Standard Analysis (V(D)J)

Demultiplex BCL files from a sequencer into FASTQs.
Construction of Immune Repertoire(Alignment,Assembling contigs,Annotating contigs,
Cell identification,Generating clonotype)
Cell Filtration
Clonotypes Statistics
CDR3 Length Statistics
Display of VJ Gene Abundance for Each Sample
Clonotypes for Displaying VJ Gene Combinations
Analysis of Highly Expressed Clonotypes by Multi-Sample Comparison
Clone Proportion Analysis
Clonal Diversity Analysis

解析例

Image
Image
1/1
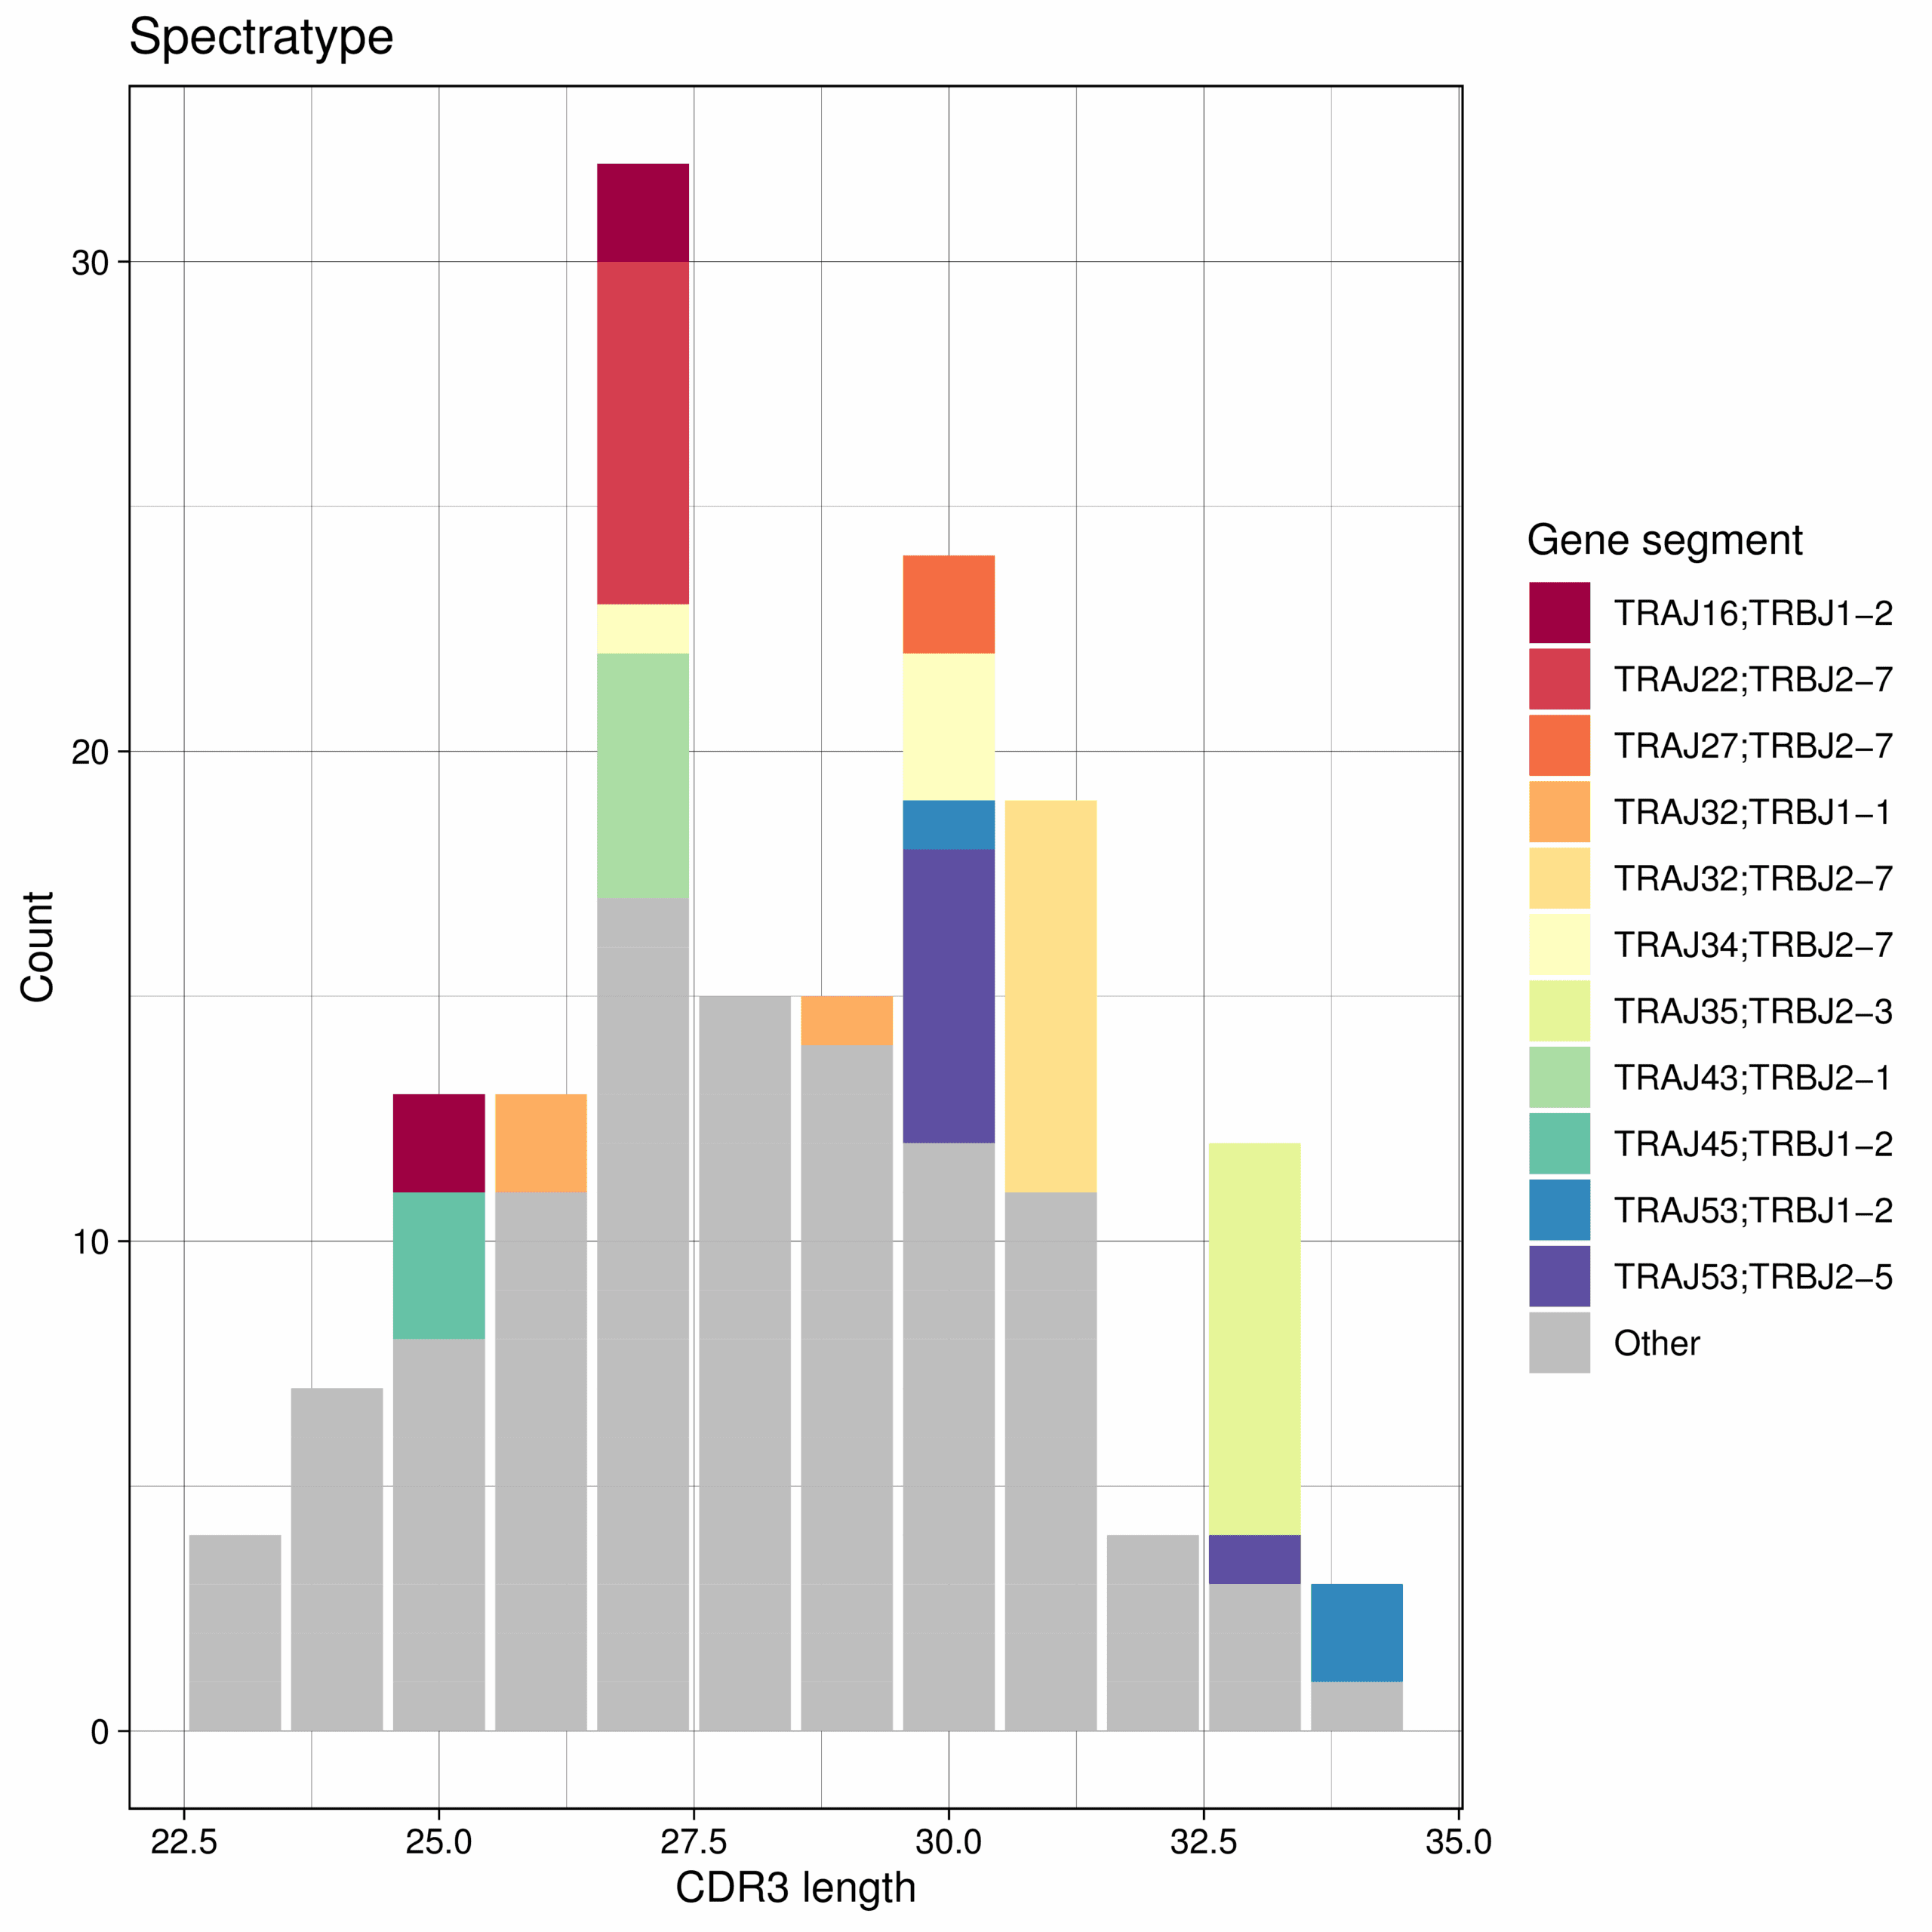
CDR3長プロファイル

CDR3長のパターンを確認し、レパトアの特性評価およびサンプル比較をサポートします。


Image
Image
1/1
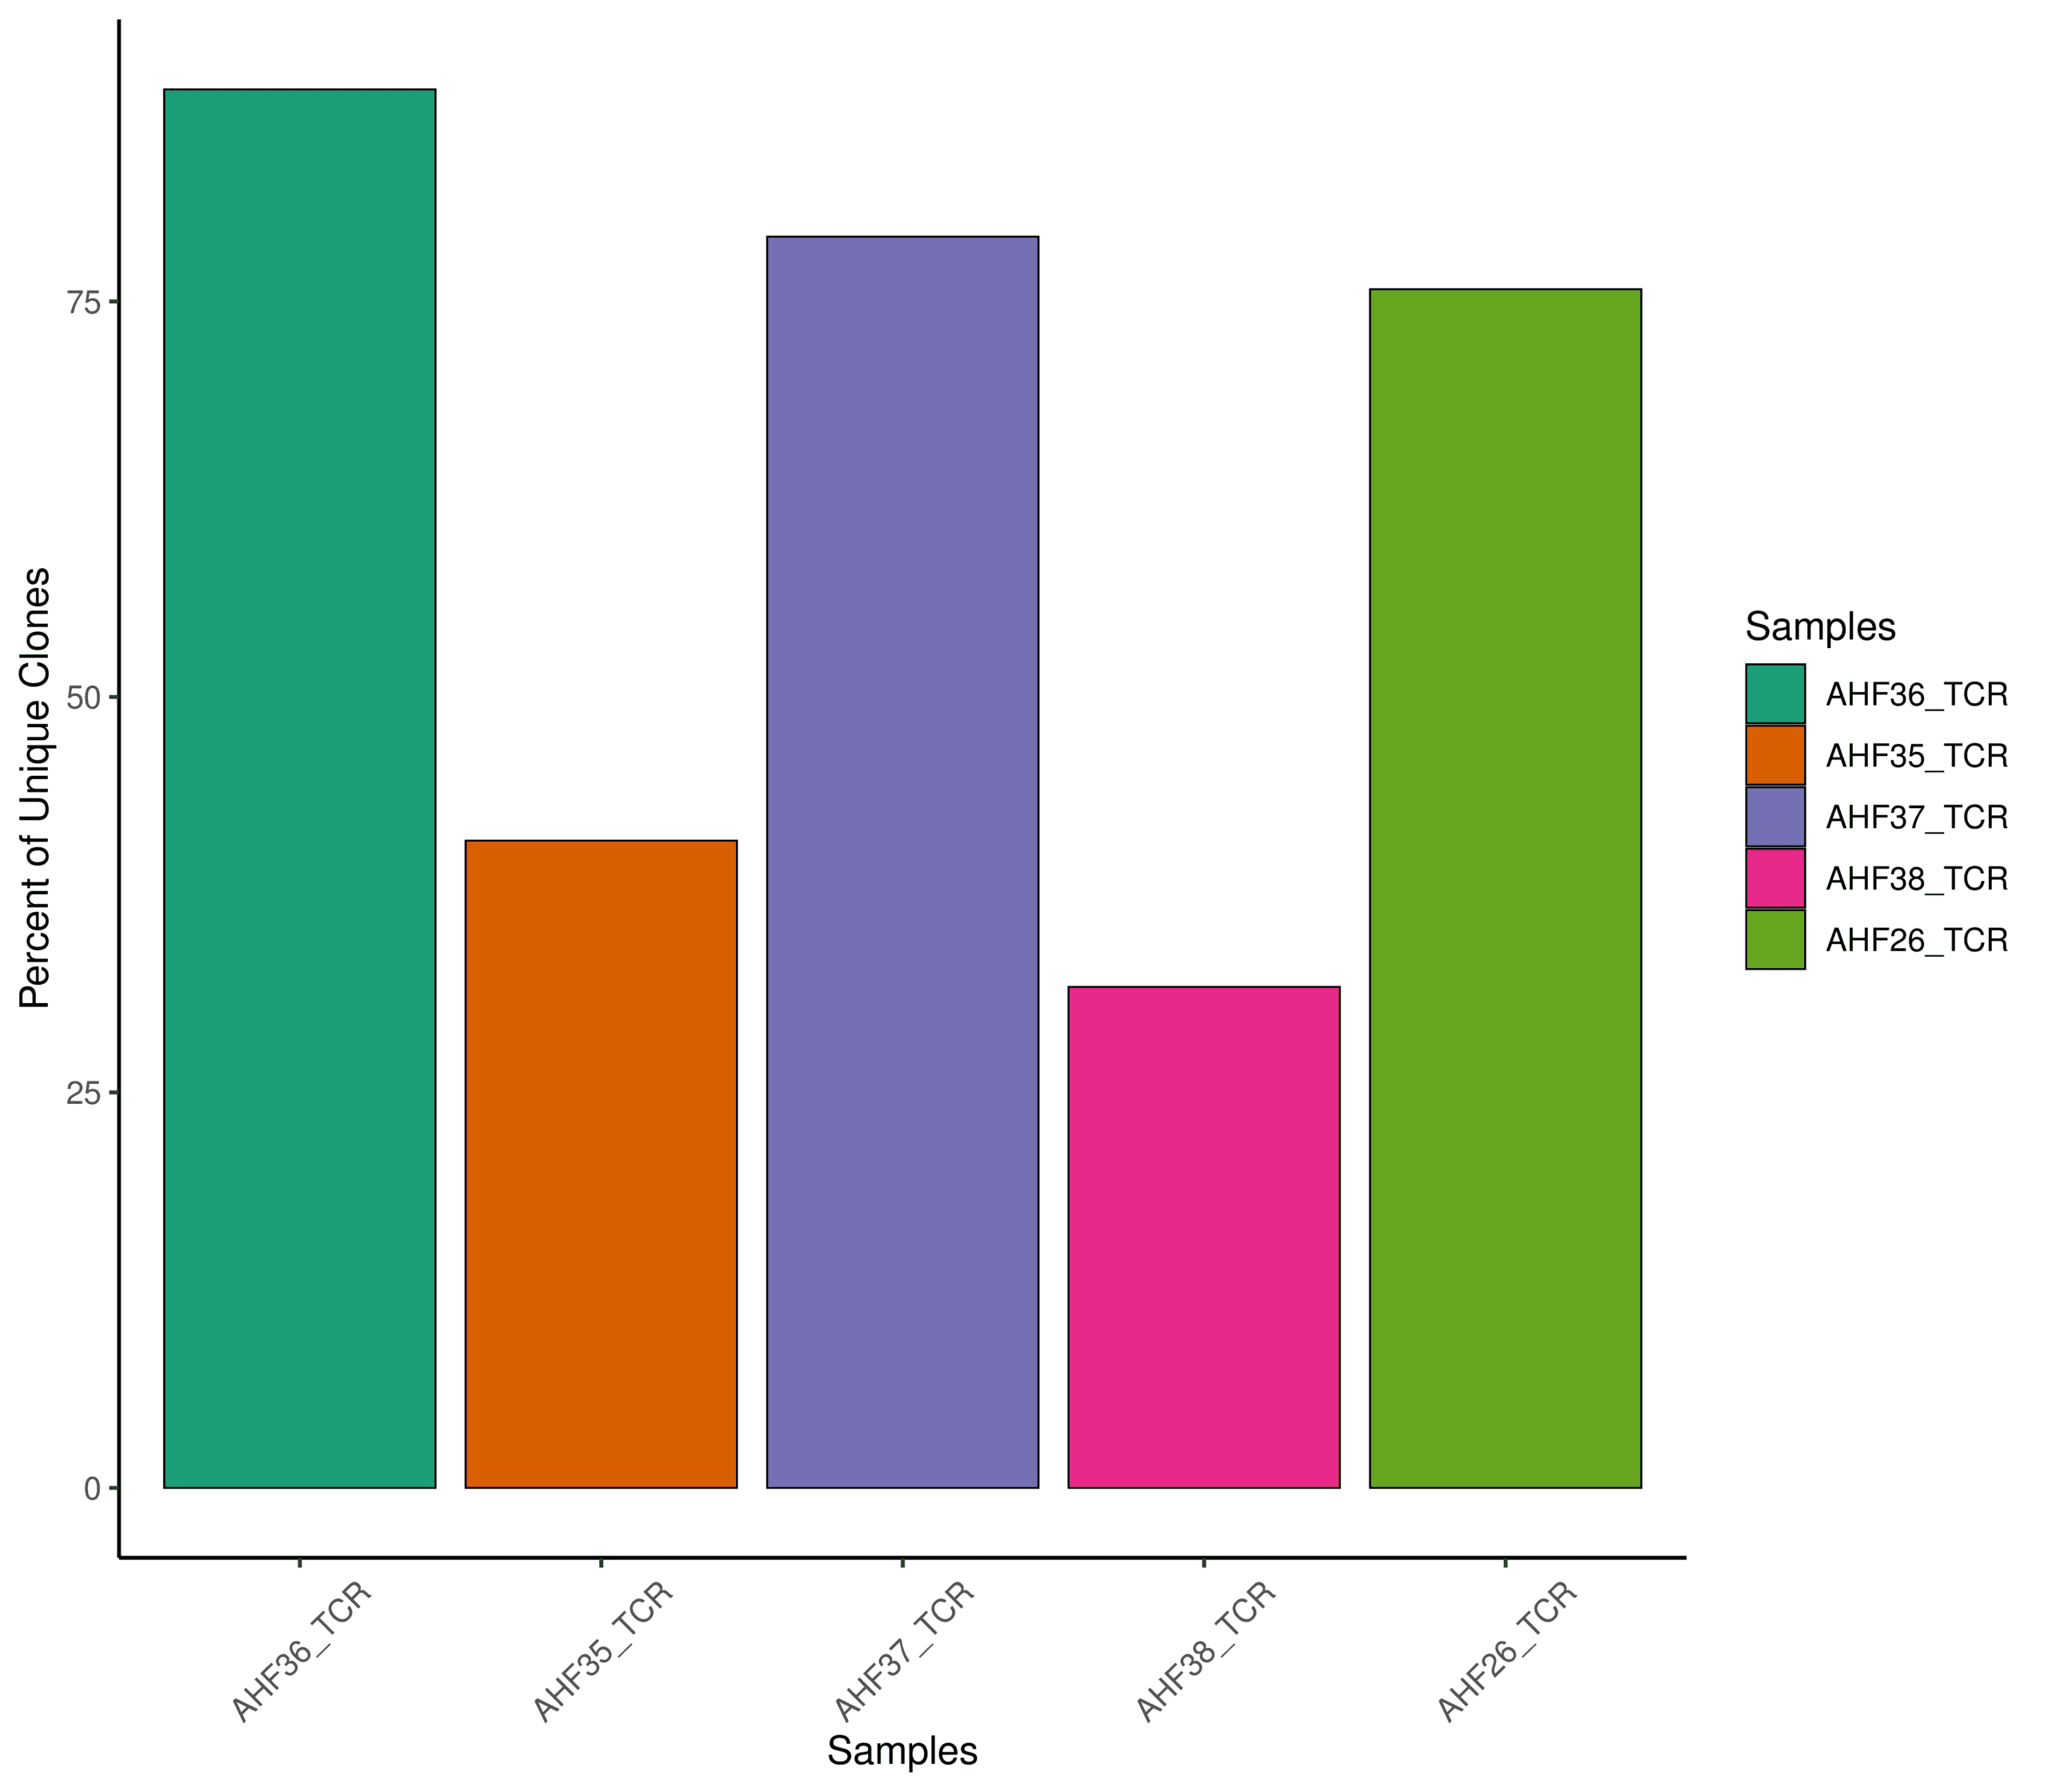
クロノタイプカウント

サンプルまたはグループ間でユニークなクロノタイプを比較し、免疫レパトアの多様性を探索します。

Image
Image
1/1
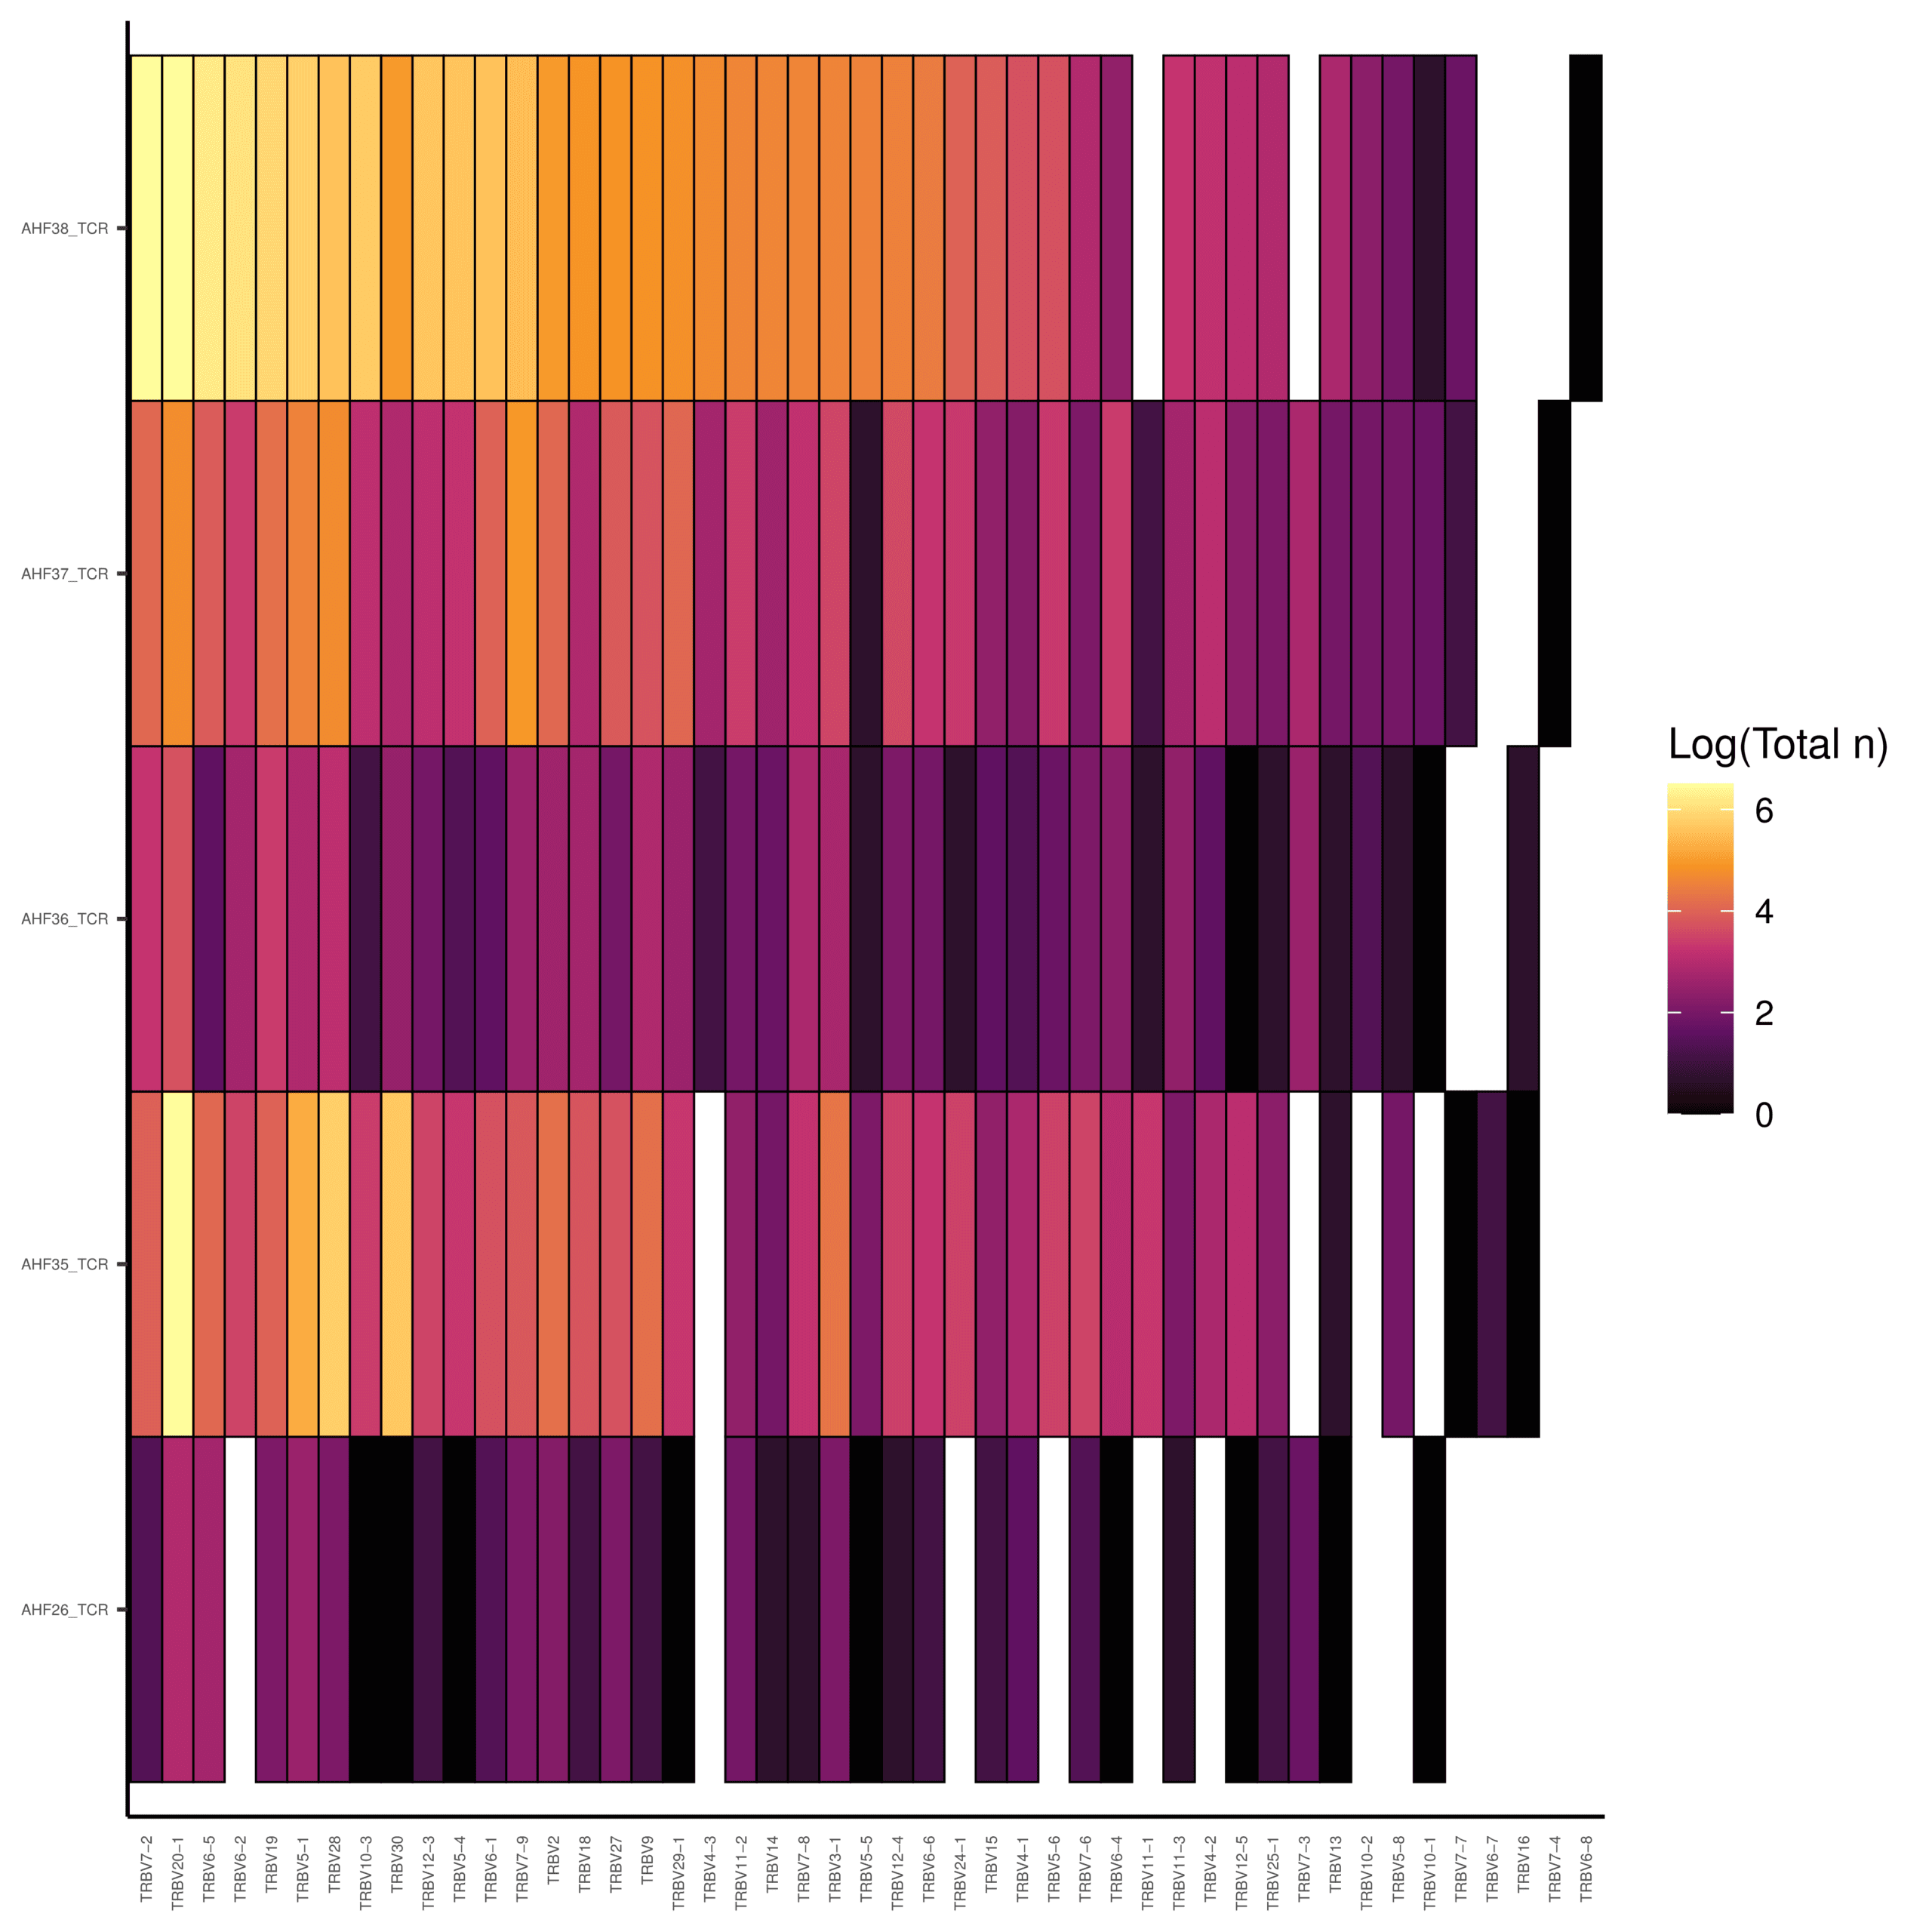
V遺伝子使用頻度

サンプル間のV遺伝子使用パターンを可視化し、T細胞レパトア内の受容体使用の違いを同定します。

Image
Image
1/1
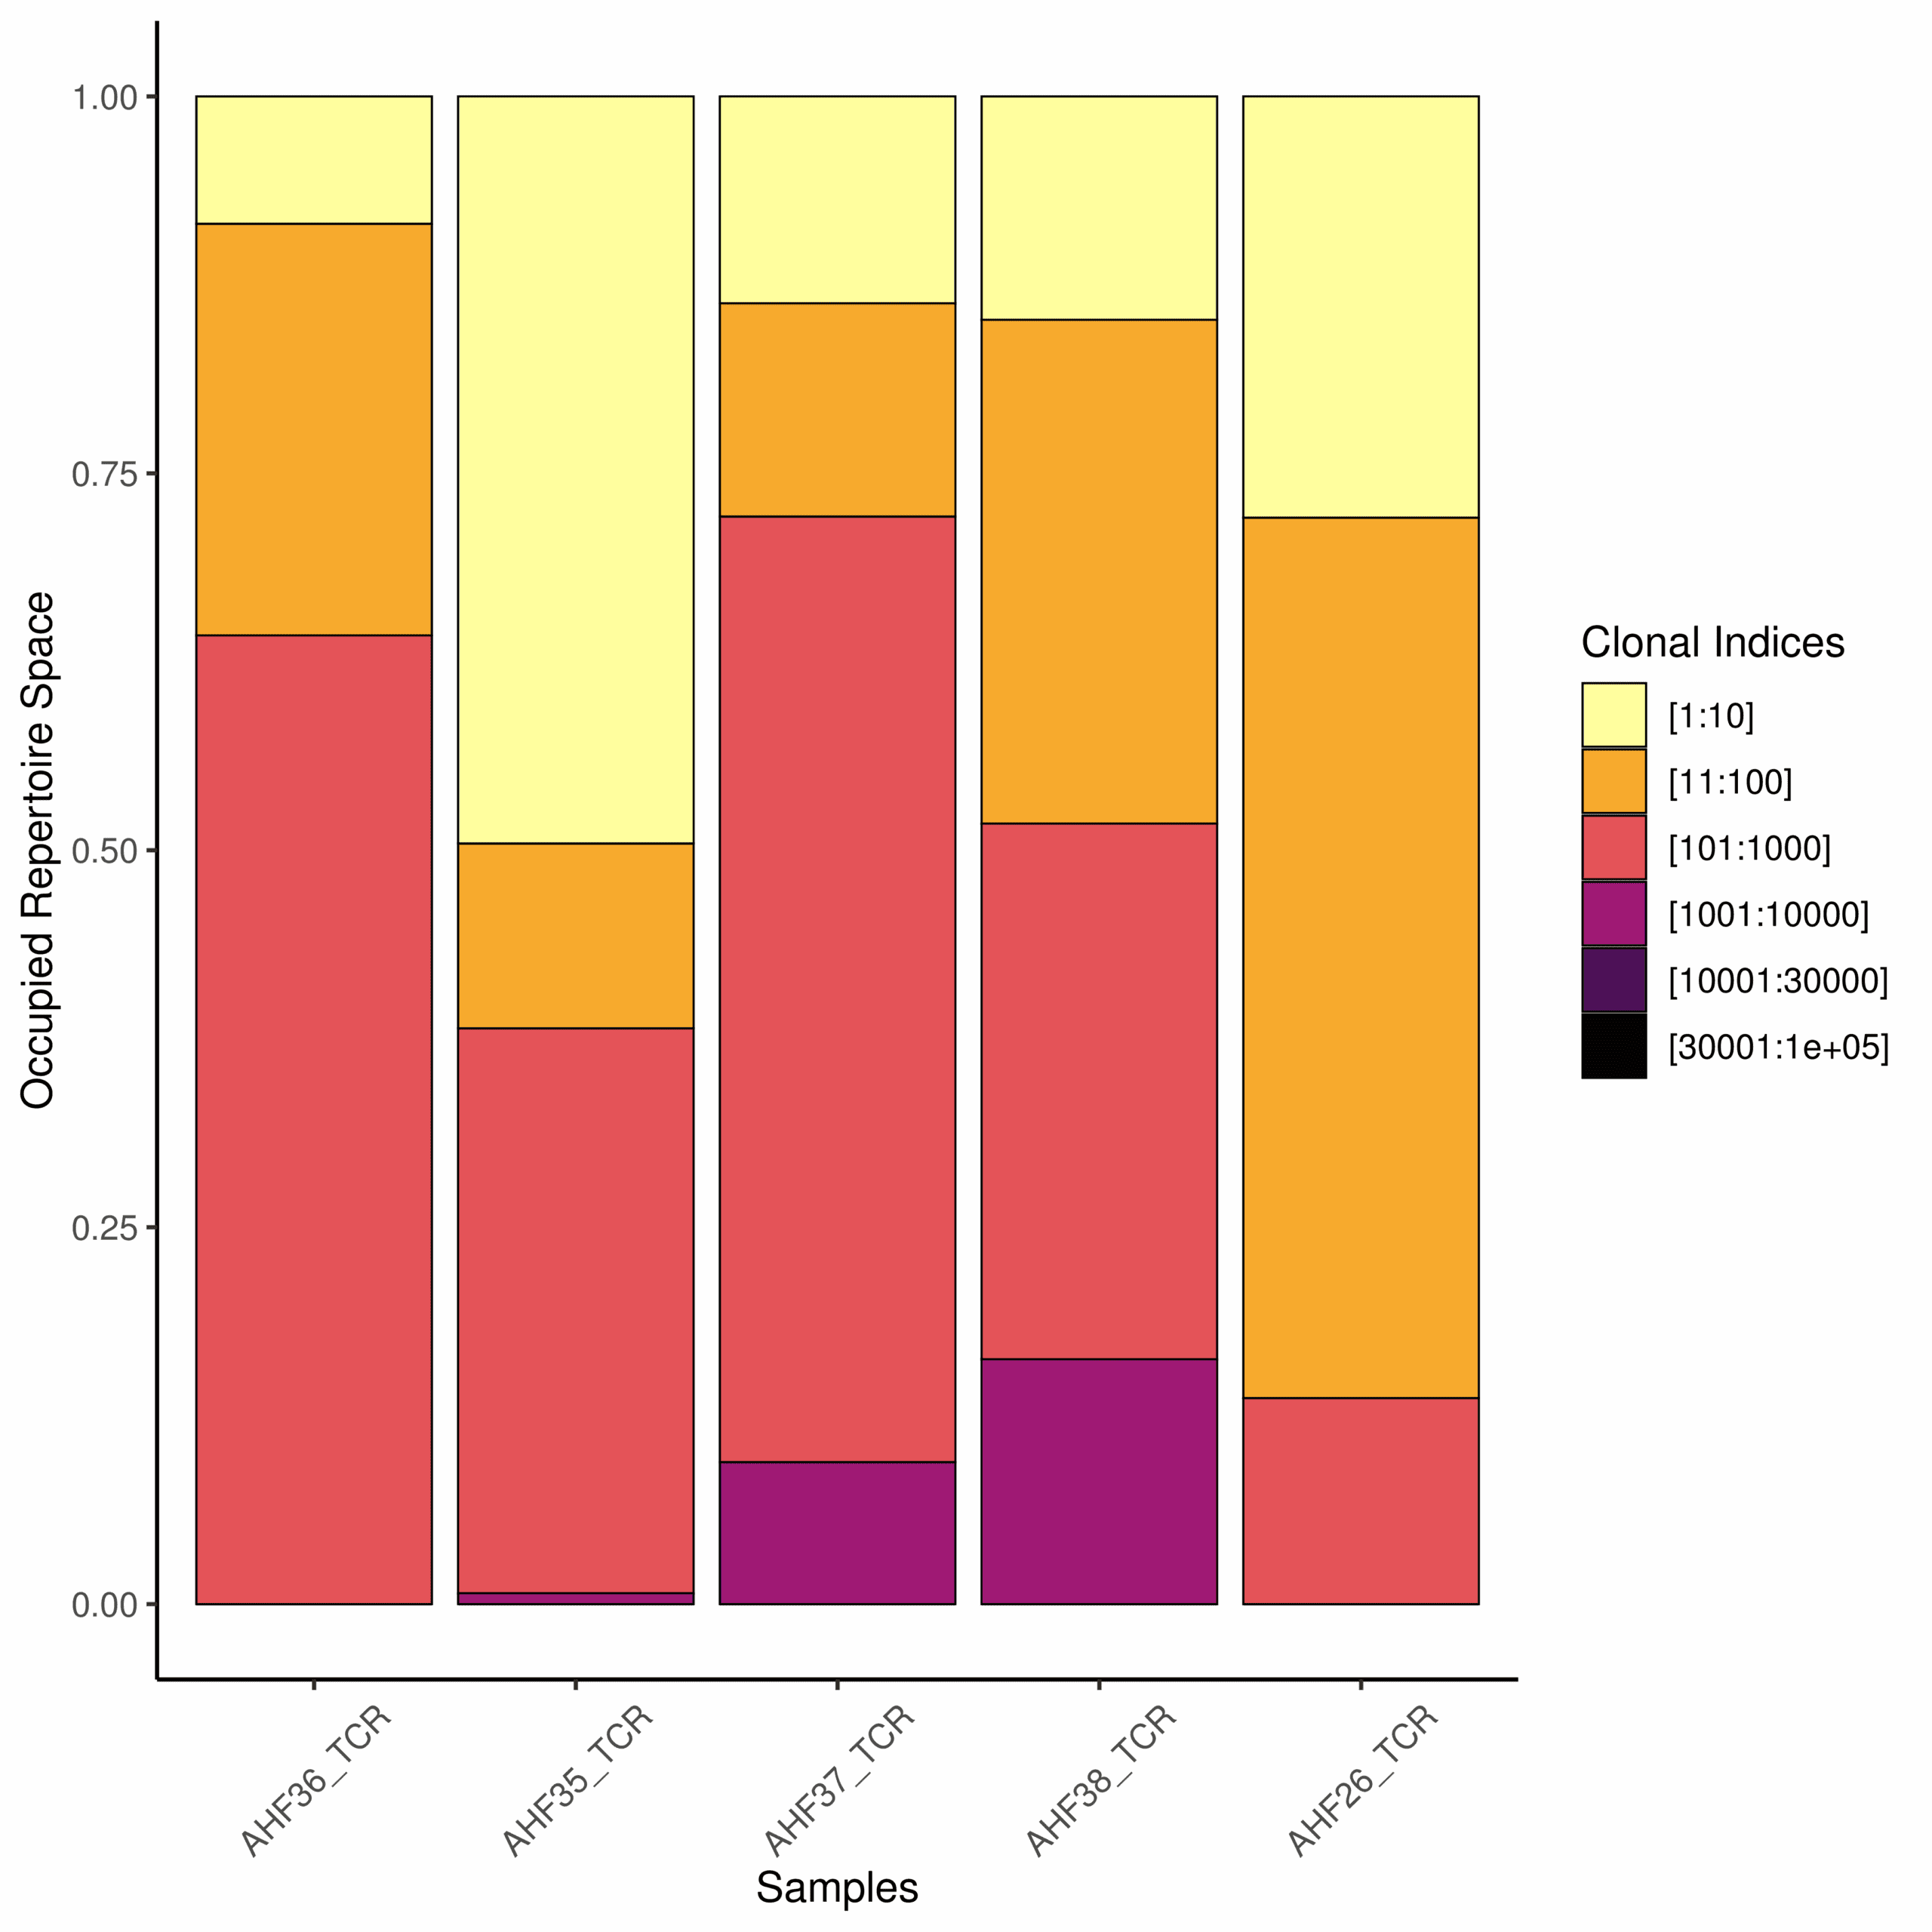
クローン割合

サンプル間におけるクローン構造を評価するために、増殖したクローンタイプおよび低頻度クローンタイプの割合を比較します。

Image
Image
1/1
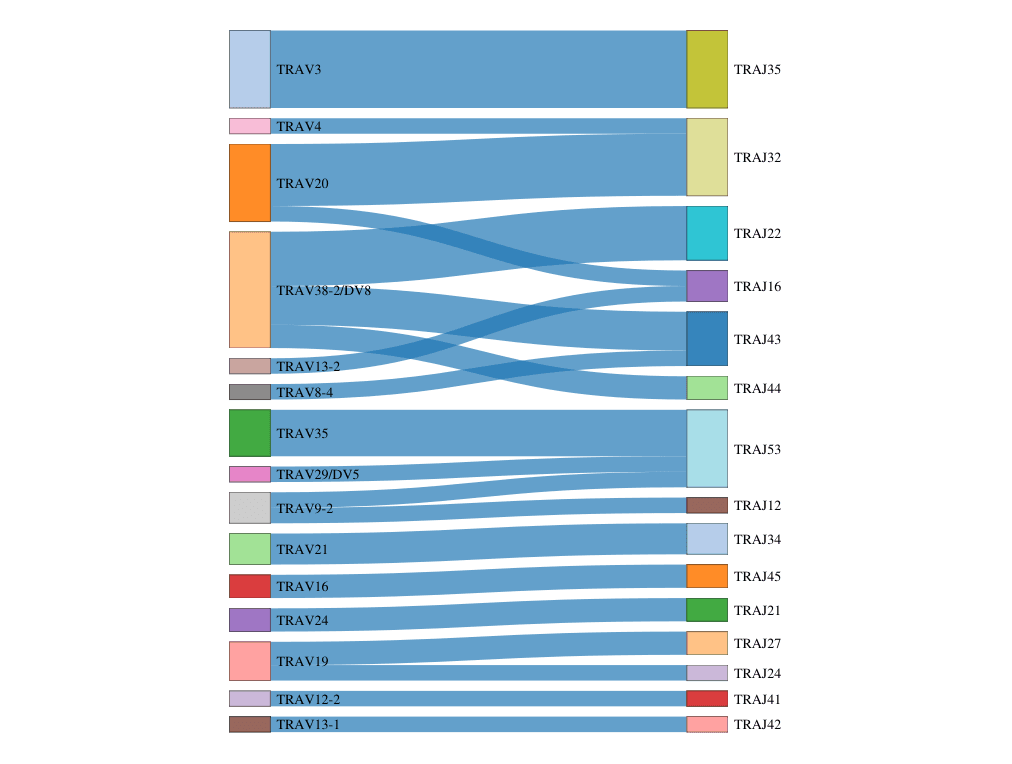
V-J遺伝子ペアリング

V-J遺伝子ペアリングの関係を可視化し、受容体再構成およびレパトア多様性の解釈をサポートします。

Image
Image
1/1
CDR3長プロファイル

CDR3長のパターンを確認し、レパトアの特性評価およびサンプル比較をサポートします。


Image
Image
1/1
クロノタイプカウント

サンプルまたはグループ間でユニークなクロノタイプを比較し、免疫レパトアの多様性を探索します。

Image
Image
1/1
V遺伝子使用頻度

サンプル間のV遺伝子使用パターンを可視化し、T細胞レパトア内の受容体使用の違いを同定します。

Image
Image
1/1
クローン割合

サンプル間におけるクローン構造を評価するために、増殖したクローンタイプおよび低頻度クローンタイプの割合を比較します。

Image
Image
1/1
V-J遺伝子ペアリング

V-J遺伝子ペアリングの関係を可視化し、受容体再構成およびレパトア多様性の解釈をサポートします。

解析例

Image
Image
1/1
CDR3長プロファイル

CDR3長のパターンを確認し、レパトアの特性評価およびサンプル比較をサポートします。


Image
Image
1/1
クロノタイプカウント

サンプルまたはグループ間でユニークなクロノタイプを比較し、免疫レパトアの多様性を探索します。

Image
Image
1/1
V遺伝子使用頻度

サンプル間のV遺伝子使用パターンを可視化し、T細胞レパトア内の受容体使用の違いを同定します。

Image
Image
1/1
クローン割合

サンプル間におけるクローン構造を評価するために、増殖したクローンタイプおよび低頻度クローンタイプの割合を比較します。

Image
Image
1/1
V-J遺伝子ペアリング

V-J遺伝子ペアリングの関係を可視化し、受容体再構成およびレパトア多様性の解釈をサポートします。

Image
Image
1/1
CDR3長プロファイル

CDR3長のパターンを確認し、レパトアの特性評価およびサンプル比較をサポートします。


Image
Image
1/1
クロノタイプカウント

サンプルまたはグループ間でユニークなクロノタイプを比較し、免疫レパトアの多様性を探索します。

Image
Image
1/1
V遺伝子使用頻度

サンプル間のV遺伝子使用パターンを可視化し、T細胞レパトア内の受容体使用の違いを同定します。

Image
Image
1/1
クローン割合

サンプル間におけるクローン構造を評価するために、増殖したクローンタイプおよび低頻度クローンタイプの割合を比較します。

Image
Image
1/1
V-J遺伝子ペアリング

V-J遺伝子ペアリングの関係を可視化し、受容体再構成およびレパトア多様性の解釈をサポートします。

その他のサービス

シングルセル遺伝子発現解析
(シングルセル遺伝子発現解析)
シングルセル遺伝子発現解析
(シングルセル遺伝子発現解析)
Visium HD 空間遺伝子発現
(Visium HD 空間遺伝子発現)
Visium HD 空間遺伝子発現
(Visium HD 空間遺伝子発現)
シングルセル・ロングリードトランスクリプトーム
(シングルセル・ロングリードトランスクリプトーム)
シングルセル・ロングリードトランスクリプトーム
(シングルセル・ロングリードトランスクリプトーム)

その他のサービス

シングルセル遺伝子発現解析
(シングルセル遺伝子発現解析)
シングルセル遺伝子発現解析
(シングルセル遺伝子発現解析)
Visium HD 空間遺伝子発現
(Visium HD 空間遺伝子発現)
Visium HD 空間遺伝子発現
(Visium HD 空間遺伝子発現)
シングルセル・ロングリードトランスクリプトーム
(シングルセル・ロングリードトランスクリプトーム)
シングルセル・ロングリードトランスクリプトーム
(シングルセル・ロングリードトランスクリプトーム)
Background
Background

プロジェクトを開始する準備はできていますか?

当社のプラットフォームは、

プロジェクト設計からデータ納品まで、お客様固有の実験ニーズに合わせたソリューションを提供し、シームレスな体験を実現します。


プライバシーポリシーCookieポリシーキャリア
banner laptop bg
banner mobile bg

シングルセル免疫プロファイリングシーケンス (10x 免疫プロファイリング)

ご相談ください
(シングルセル免疫プロファイリングシーケンス (10x 免疫プロファイリング))
ご相談ください
(シングルセル免疫プロファイリングシーケンス (10x 免疫プロファイリング))
概要概要
利点利点
アプリケーションアプリケーション
仕様仕様
リソースリソース

5′ GEXは、完全な免疫細胞および非免疫細胞における転写の不均一生を捉え、細胞タイプ、活性化状態、機能プログラムの同定を促進します。この10x scRNA-seqベースのシングルセルRNA-seqアプローチは、複雑な免疫集団全体にわたる高解像度のシングルセル遺伝子発現データを生成します。T細胞受容体(TCR)およびB細胞受容体(BCR)シーケンスと組み合わせることで、本プラットフォームは遺伝子発現と免疫クローナリティの同時解析を可能にし、クローン拡大と免疫細胞表現型に関する知見を提供します。


ノボジーンの5' GEX および免疫プロファイリング ソリューションは、最新の10x Genomics Chromium iX プラットフォームと GEM-X 化学ベースのユニバーサル 5' 遺伝子発現アッセイによって強化されていて、高感度・再現性・信頼性の高い性能を実現しています。ノボジーンの合理化されたエンドツーエンドワークフローには、サンプル処理と品質管理、シングルセルライブラリ調製、NovaSeq X Plusによるハイスループットシーケンス、包括的なバイオインフォマティクス解析が含まれます。また、直感的なデータ解釈をサポートし生物学的発見を加速させるため、論文化可能な明確な可視化データを提供します。

なぜノボジーンが5' GEXと免疫プロファイリングに選ばれるのか

エンドツーエンドサービス
エンドツーエンドサービス

サンプル処理(新鮮組織の分離、核の分離)とQC、シングルセルライブラリ調製、シーケンス、そして「論文掲載可能な」図表付きバイオインフォマティクス解析を含みます。

エンドツーエンドサービス
エンドツーエンドサービス

サンプル処理(新鮮組織の分離、核の分離)とQC、シングルセルライブラリ調製、シーケンス、そして「論文掲載可能な」図表付きバイオインフォマティクス解析を含みます。

高品質データ
高品質データ

QC基準を通過したサンプルに対し、データ出力保証と業界トップクラスの基準を満たす高品質シーケンスデータを提供します。

高品質データ
高品質データ

QC基準を通過したサンプルに対し、データ出力保証と業界トップクラスの基準を満たす高品質シーケンスデータを提供します。

バイオインフォマティクスサポート
バイオインフォマティクスサポート

バイオインフォマティクスサポート:研究者が生物学的データから深い知見を得られるよう、包括的なバイオインフォマティクスサポートを提供します。分野の最新解析アルゴリズムを用いた標準パイプラインからカスタマイズソリューションまで対応しています。

バイオインフォマティクスサポート
バイオインフォマティクスサポート

バイオインフォマティクスサポート:研究者が生物学的データから深い知見を得られるよう、包括的なバイオインフォマティクスサポートを提供します。分野の最新解析アルゴリズムを用いた標準パイプラインからカスタマイズソリューションまで対応しています。

最新テクノロジー
最新テクノロジー

10x Genomics社の最新Chromium iXおよびGEM-Xケミストリーを活用し、免疫プロファイリング付き最先端scRNA-seqサービスを提供します。

最新テクノロジー
最新テクノロジー

10x Genomics社の最新Chromium iXおよびGEM-Xケミストリーを活用し、免疫プロファイリング付き最先端scRNA-seqサービスを提供します。

費用対効果の高いソリューション
費用対効果の高いソリューション

ノボジーンは最先端のハイスループット シーケンス プラットフォームを備えており、専門家によるサポートと組み合わせることで、優れたデータ品質を保証し、シングルセルプロジェクトに費用対効果の高いソリューションを提供します。

費用対効果の高いソリューション
費用対効果の高いソリューション

ノボジーンは最先端のハイスループット シーケンス プラットフォームを備えており、専門家によるサポートと組み合わせることで、優れたデータ品質を保証し、シングルセルプロジェクトに費用対効果の高いソリューションを提供します。

なぜノボジーンが5' GEXと免疫プロファイリングに選ばれるのか

エンドツーエンドサービス
エンドツーエンドサービス

サンプル処理(新鮮組織の分離、核の分離)とQC、シングルセルライブラリ調製、シーケンス、そして「論文掲載可能な」図表付きバイオインフォマティクス解析を含みます。

エンドツーエンドサービス
エンドツーエンドサービス

サンプル処理(新鮮組織の分離、核の分離)とQC、シングルセルライブラリ調製、シーケンス、そして「論文掲載可能な」図表付きバイオインフォマティクス解析を含みます。

高品質データ
高品質データ

QC基準を通過したサンプルに対し、データ出力保証と業界トップクラスの基準を満たす高品質シーケンスデータを提供します。

高品質データ
高品質データ

QC基準を通過したサンプルに対し、データ出力保証と業界トップクラスの基準を満たす高品質シーケンスデータを提供します。

バイオインフォマティクスサポート
バイオインフォマティクスサポート

バイオインフォマティクスサポート:研究者が生物学的データから深い知見を得られるよう、包括的なバイオインフォマティクスサポートを提供します。分野の最新解析アルゴリズムを用いた標準パイプラインからカスタマイズソリューションまで対応しています。

バイオインフォマティクスサポート
バイオインフォマティクスサポート

バイオインフォマティクスサポート:研究者が生物学的データから深い知見を得られるよう、包括的なバイオインフォマティクスサポートを提供します。分野の最新解析アルゴリズムを用いた標準パイプラインからカスタマイズソリューションまで対応しています。

最新テクノロジー
最新テクノロジー

10x Genomics社の最新Chromium iXおよびGEM-Xケミストリーを活用し、免疫プロファイリング付き最先端scRNA-seqサービスを提供します。

最新テクノロジー
最新テクノロジー

10x Genomics社の最新Chromium iXおよびGEM-Xケミストリーを活用し、免疫プロファイリング付き最先端scRNA-seqサービスを提供します。

費用対効果の高いソリューション
費用対効果の高いソリューション

ノボジーンは最先端のハイスループット シーケンス プラットフォームを備えており、専門家によるサポートと組み合わせることで、優れたデータ品質を保証し、シングルセルプロジェクトに費用対効果の高いソリューションを提供します。

費用対効果の高いソリューション
費用対効果の高いソリューション

ノボジーンは最先端のハイスループット シーケンス プラットフォームを備えており、専門家によるサポートと組み合わせることで、優れたデータ品質を保証し、シングルセルプロジェクトに費用対効果の高いソリューションを提供します。

研究と医療における10×免疫プロファイリングの応用

10×免疫プロファイリングは、以下の研究領域における免疫多様性の解析をサポートしています:

腫瘍微小環境

腫瘍免疫微小環境の特徴と免疫療法の反応メカニズムを解明

腫瘍微小環境

腫瘍免疫微小環境の特徴と免疫療法の反応メカニズムを解明

感染症

病原体特異的クローンの解析による感染メカニズムの解明と抗ウイルス療法のエビデンス提供

感染症

病原体特異的クローンの解析による感染メカニズムの解明と抗ウイルス療法のエビデンス提供

自己免疫疾患

免疫レパトアのクローン進化を追跡し、異常増殖したT細胞/B細胞サブポピュレーションを同定、疾患サブタイピングと標的発見を支援

自己免疫疾患

免疫レパトアのクローン進化を追跡し、異常増殖したT細胞/B細胞サブポピュレーションを同定、疾患サブタイピングと標的発見を支援

ワクチン候補スクリーニング

特異的TCR/BCRの迅速スクリーニングによるワクチン候補の検証加速

ワクチン候補スクリーニング

特異的TCR/BCRの迅速スクリーニングによるワクチン候補の検証加速

研究と医療における10×免疫プロファイリングの応用

10×免疫プロファイリングは、以下の研究領域における免疫多様性の解析をサポートしています:

腫瘍微小環境

腫瘍免疫微小環境の特徴と免疫療法の反応メカニズムを解明

腫瘍微小環境

腫瘍免疫微小環境の特徴と免疫療法の反応メカニズムを解明

感染症

病原体特異的クローンの解析による感染メカニズムの解明と抗ウイルス療法のエビデンス提供

感染症

病原体特異的クローンの解析による感染メカニズムの解明と抗ウイルス療法のエビデンス提供

自己免疫疾患

免疫レパトアのクローン進化を追跡し、異常増殖したT細胞/B細胞サブポピュレーションを同定、疾患サブタイピングと標的発見を支援

自己免疫疾患

免疫レパトアのクローン進化を追跡し、異常増殖したT細胞/B細胞サブポピュレーションを同定、疾患サブタイピングと標的発見を支援

ワクチン候補スクリーニング

特異的TCR/BCRの迅速スクリーニングによるワクチン候補の検証加速

ワクチン候補スクリーニング

特異的TCR/BCRの迅速スクリーニングによるワクチン候補の検証加速

仕様

サンプル要件

サンプル量は参考値です。以下をダウンロードしてご確認ください。詳細については、サンプル要件をダウンロードしてご確認ください。カスタマイズされたご要望については、お問い合わせください 。

サービスサンプル種*サンプルタイプサンプル量輸送条件
5' GEX + TCR/BCRHuman/MouseFresh single cell suspensionRecommended Amount: > 1,000,000 cells per sample;Needs to be shipped with ice packs within 2hrs
Frozen single cell suspensionRecommended Amount: > 1,000,000 cells per sample;Ship with sufficient dry ice
Fresh tissueTissue weight ≥ 200mg
(minimum ≥ 100mg)
≥ 2 tissue pieces/sample, separate 1.5ml cryovials
Needs to be shipped with ice packs within 48hrs of harvest

サンプル要件

サンプル量は参考値です。以下をダウンロードしてご確認ください。詳細については、サンプル要件をダウンロードしてご確認ください。カスタマイズされたご要望については、お問い合わせください 。

サービスサンプル種*サンプルタイプサンプル量輸送条件
5' GEX + TCR/BCRHuman/MouseFresh single cell suspensionRecommended Amount: > 1,000,000 cells per sample;Needs to be shipped with ice packs within 2hrs
Frozen single cell suspensionRecommended Amount: > 1,000,000 cells per sample;Ship with sufficient dry ice
Fresh tissueTissue weight ≥ 200mg
(minimum ≥ 100mg)
≥ 2 tissue pieces/sample, separate 1.5ml cryovials
Needs to be shipped with ice packs within 48hrs of harvest

サンプル要件

サンプル量は参考値です。以下をダウンロードしてご確認ください。詳細については、サンプル要件をダウンロードしてご確認ください。カスタマイズされたご要望については、お問い合わせください 。

サービスサンプル種*サンプルタイプサンプル量輸送条件
5' GEX + TCR/BCRHuman/MouseFresh single cell suspensionRecommended Amount: > 1,000,000 cells per sample;Needs to be shipped with ice packs within 2hrs
Frozen single cell suspensionRecommended Amount: > 1,000,000 cells per sample;Ship with sufficient dry ice
Fresh tissueTissue weight ≥ 200mg
(minimum ≥ 100mg)
≥ 2 tissue pieces/sample, separate 1.5ml cryovials
Needs to be shipped with ice packs within 48hrs of harvest

サンプル要件

サンプル量は参考値です。以下をダウンロードしてご確認ください。詳細については、サンプル要件をダウンロードしてご確認ください。カスタマイズされたご要望については、お問い合わせください 。

サービスサンプル種*サンプルタイプサンプル量輸送条件
5' GEX + TCR/BCRHuman/MouseFresh single cell suspensionRecommended Amount: > 1,000,000 cells per sample;Needs to be shipped with ice packs within 2hrs
Frozen single cell suspensionRecommended Amount: > 1,000,000 cells per sample;Ship with sufficient dry ice
Fresh tissueTissue weight ≥ 200mg
(minimum ≥ 100mg)
≥ 2 tissue pieces/sample, separate 1.5ml cryovials
Needs to be shipped with ice packs within 48hrs of harvest

シーケンスおよび解析

表示されている推奨データ量および解析内容は参考値です。カスタマイズされたご要望については、 お問い合わせください 。

シーケンス
プラットフォーム
Illumina NovaSeq X-Plus Sequencing Platform
Read LengthPaired-end 150 bp
Recommended DataMinimum 20,000 read pairs/cell for gene expression; 5,000 read pairs/cell for V(D)J
AnalysisCell Ranger Analysis (Gene Expression)

Demultiplex BCL files from a sequencer into FASTQs.
Summary metrics (sequencing quality, number of cells detected, the mean reads per cell, and the median genes detected per cell et al.).
Alignment of reads to genome.
Gene expression quantification.
Clustering analysis.
Differentially expression analysis between clusters.
Visualization.
Standard Analysis (Gene Expression)

Demultiplex BCL files from a sequencer into FASTQs.
Alignment, UMI counting, Metrics summary.
Identification of highly variable gene (HVGs).
Cell Subpopulation Identification.
Principal component analysis (PCA).
Identify clusters of cells.
Dimensionality reduction and Visualization.
Marker gene detection (Differentially expression analysis between clusters).
GO/KEGG/Reactome Enrichment.
FunctionalAnnotation of Transcription Factor.
Protein-Protein Interaction Network Analysis.
Standard Analysis (V(D)J)

Demultiplex BCL files from a sequencer into FASTQs.
Construction of Immune Repertoire(Alignment,Assembling contigs,Annotating contigs,
Cell identification,Generating clonotype)
Cell Filtration
Clonotypes Statistics
CDR3 Length Statistics
Display of VJ Gene Abundance for Each Sample
Clonotypes for Displaying VJ Gene Combinations
Analysis of Highly Expressed Clonotypes by Multi-Sample Comparison
Clone Proportion Analysis
Clonal Diversity Analysis

シーケンスおよび解析

表示されている推奨データ量および解析内容は参考値です。カスタマイズされたご要望については、 お問い合わせください 。

シーケンス
プラットフォーム
Illumina NovaSeq X-Plus Sequencing Platform
Read LengthPaired-end 150 bp
Recommended DataMinimum 20,000 read pairs/cell for gene expression; 5,000 read pairs/cell for V(D)J
AnalysisCell Ranger Analysis (Gene Expression)

Demultiplex BCL files from a sequencer into FASTQs.
Summary metrics (sequencing quality, number of cells detected, the mean reads per cell, and the median genes detected per cell et al.).
Alignment of reads to genome.
Gene expression quantification.
Clustering analysis.
Differentially expression analysis between clusters.
Visualization.
Standard Analysis (Gene Expression)

Demultiplex BCL files from a sequencer into FASTQs.
Alignment, UMI counting, Metrics summary.
Identification of highly variable gene (HVGs).
Cell Subpopulation Identification.
Principal component analysis (PCA).
Identify clusters of cells.
Dimensionality reduction and Visualization.
Marker gene detection (Differentially expression analysis between clusters).
GO/KEGG/Reactome Enrichment.
FunctionalAnnotation of Transcription Factor.
Protein-Protein Interaction Network Analysis.
Standard Analysis (V(D)J)

Demultiplex BCL files from a sequencer into FASTQs.
Construction of Immune Repertoire(Alignment,Assembling contigs,Annotating contigs,
Cell identification,Generating clonotype)
Cell Filtration
Clonotypes Statistics
CDR3 Length Statistics
Display of VJ Gene Abundance for Each Sample
Clonotypes for Displaying VJ Gene Combinations
Analysis of Highly Expressed Clonotypes by Multi-Sample Comparison
Clone Proportion Analysis
Clonal Diversity Analysis

シーケンスおよび解析

表示されている推奨データ量および解析内容は参考値です。カスタマイズされたご要望については、 お問い合わせください 。

シーケンス
プラットフォーム
Illumina NovaSeq X-Plus Sequencing Platform
Read LengthPaired-end 150 bp
Recommended DataMinimum 20,000 read pairs/cell for gene expression; 5,000 read pairs/cell for V(D)J
AnalysisCell Ranger Analysis (Gene Expression)

Demultiplex BCL files from a sequencer into FASTQs.
Summary metrics (sequencing quality, number of cells detected, the mean reads per cell, and the median genes detected per cell et al.).
Alignment of reads to genome.
Gene expression quantification.
Clustering analysis.
Differentially expression analysis between clusters.
Visualization.
Standard Analysis (Gene Expression)

Demultiplex BCL files from a sequencer into FASTQs.
Alignment, UMI counting, Metrics summary.
Identification of highly variable gene (HVGs).
Cell Subpopulation Identification.
Principal component analysis (PCA).
Identify clusters of cells.
Dimensionality reduction and Visualization.
Marker gene detection (Differentially expression analysis between clusters).
GO/KEGG/Reactome Enrichment.
FunctionalAnnotation of Transcription Factor.
Protein-Protein Interaction Network Analysis.
Standard Analysis (V(D)J)

Demultiplex BCL files from a sequencer into FASTQs.
Construction of Immune Repertoire(Alignment,Assembling contigs,Annotating contigs,
Cell identification,Generating clonotype)
Cell Filtration
Clonotypes Statistics
CDR3 Length Statistics
Display of VJ Gene Abundance for Each Sample
Clonotypes for Displaying VJ Gene Combinations
Analysis of Highly Expressed Clonotypes by Multi-Sample Comparison
Clone Proportion Analysis
Clonal Diversity Analysis

シーケンスおよび解析

表示されている推奨データ量および解析内容は参考値です。カスタマイズされたご要望については、 お問い合わせください 。

シーケンス
プラットフォーム
Illumina NovaSeq X-Plus Sequencing Platform
Read LengthPaired-end 150 bp
Recommended DataMinimum 20,000 read pairs/cell for gene expression; 5,000 read pairs/cell for V(D)J
AnalysisCell Ranger Analysis (Gene Expression)

Demultiplex BCL files from a sequencer into FASTQs.
Summary metrics (sequencing quality, number of cells detected, the mean reads per cell, and the median genes detected per cell et al.).
Alignment of reads to genome.
Gene expression quantification.
Clustering analysis.
Differentially expression analysis between clusters.
Visualization.
Standard Analysis (Gene Expression)

Demultiplex BCL files from a sequencer into FASTQs.
Alignment, UMI counting, Metrics summary.
Identification of highly variable gene (HVGs).
Cell Subpopulation Identification.
Principal component analysis (PCA).
Identify clusters of cells.
Dimensionality reduction and Visualization.
Marker gene detection (Differentially expression analysis between clusters).
GO/KEGG/Reactome Enrichment.
FunctionalAnnotation of Transcription Factor.
Protein-Protein Interaction Network Analysis.
Standard Analysis (V(D)J)

Demultiplex BCL files from a sequencer into FASTQs.
Construction of Immune Repertoire(Alignment,Assembling contigs,Annotating contigs,
Cell identification,Generating clonotype)
Cell Filtration
Clonotypes Statistics
CDR3 Length Statistics
Display of VJ Gene Abundance for Each Sample
Clonotypes for Displaying VJ Gene Combinations
Analysis of Highly Expressed Clonotypes by Multi-Sample Comparison
Clone Proportion Analysis
Clonal Diversity Analysis

仕様

サンプル要件

サンプル量は参考値です。以下をダウンロードしてご確認ください。詳細については、サンプル要件をダウンロードしてご確認ください。カスタマイズされたご要望については、お問い合わせください 。

サービスサンプル種*サンプルタイプサンプル量輸送条件
5' GEX + TCR/BCRHuman/MouseFresh single cell suspensionRecommended Amount: > 1,000,000 cells per sample;Needs to be shipped with ice packs within 2hrs
Frozen single cell suspensionRecommended Amount: > 1,000,000 cells per sample;Ship with sufficient dry ice
Fresh tissueTissue weight ≥ 200mg
(minimum ≥ 100mg)
≥ 2 tissue pieces/sample, separate 1.5ml cryovials
Needs to be shipped with ice packs within 48hrs of harvest

サンプル要件

サンプル量は参考値です。以下をダウンロードしてご確認ください。詳細については、サンプル要件をダウンロードしてご確認ください。カスタマイズされたご要望については、お問い合わせください 。

サービスサンプル種*サンプルタイプサンプル量輸送条件
5' GEX + TCR/BCRHuman/MouseFresh single cell suspensionRecommended Amount: > 1,000,000 cells per sample;Needs to be shipped with ice packs within 2hrs
Frozen single cell suspensionRecommended Amount: > 1,000,000 cells per sample;Ship with sufficient dry ice
Fresh tissueTissue weight ≥ 200mg
(minimum ≥ 100mg)
≥ 2 tissue pieces/sample, separate 1.5ml cryovials
Needs to be shipped with ice packs within 48hrs of harvest

サンプル要件

サンプル量は参考値です。以下をダウンロードしてご確認ください。詳細については、サンプル要件をダウンロードしてご確認ください。カスタマイズされたご要望については、お問い合わせください 。

サービスサンプル種*サンプルタイプサンプル量輸送条件
5' GEX + TCR/BCRHuman/MouseFresh single cell suspensionRecommended Amount: > 1,000,000 cells per sample;Needs to be shipped with ice packs within 2hrs
Frozen single cell suspensionRecommended Amount: > 1,000,000 cells per sample;Ship with sufficient dry ice
Fresh tissueTissue weight ≥ 200mg
(minimum ≥ 100mg)
≥ 2 tissue pieces/sample, separate 1.5ml cryovials
Needs to be shipped with ice packs within 48hrs of harvest

サンプル要件

サンプル量は参考値です。以下をダウンロードしてご確認ください。詳細については、サンプル要件をダウンロードしてご確認ください。カスタマイズされたご要望については、お問い合わせください 。

サービスサンプル種*サンプルタイプサンプル量輸送条件
5' GEX + TCR/BCRHuman/MouseFresh single cell suspensionRecommended Amount: > 1,000,000 cells per sample;Needs to be shipped with ice packs within 2hrs
Frozen single cell suspensionRecommended Amount: > 1,000,000 cells per sample;Ship with sufficient dry ice
Fresh tissueTissue weight ≥ 200mg
(minimum ≥ 100mg)
≥ 2 tissue pieces/sample, separate 1.5ml cryovials
Needs to be shipped with ice packs within 48hrs of harvest

シーケンスおよび解析

表示されている推奨データ量および解析内容は参考値です。カスタマイズされたご要望については、 お問い合わせください 。

シーケンス
プラットフォーム
Illumina NovaSeq X-Plus Sequencing Platform
Read LengthPaired-end 150 bp
Recommended DataMinimum 20,000 read pairs/cell for gene expression; 5,000 read pairs/cell for V(D)J
AnalysisCell Ranger Analysis (Gene Expression)

Demultiplex BCL files from a sequencer into FASTQs.
Summary metrics (sequencing quality, number of cells detected, the mean reads per cell, and the median genes detected per cell et al.).
Alignment of reads to genome.
Gene expression quantification.
Clustering analysis.
Differentially expression analysis between clusters.
Visualization.
Standard Analysis (Gene Expression)

Demultiplex BCL files from a sequencer into FASTQs.
Alignment, UMI counting, Metrics summary.
Identification of highly variable gene (HVGs).
Cell Subpopulation Identification.
Principal component analysis (PCA).
Identify clusters of cells.
Dimensionality reduction and Visualization.
Marker gene detection (Differentially expression analysis between clusters).
GO/KEGG/Reactome Enrichment.
FunctionalAnnotation of Transcription Factor.
Protein-Protein Interaction Network Analysis.
Standard Analysis (V(D)J)

Demultiplex BCL files from a sequencer into FASTQs.
Construction of Immune Repertoire(Alignment,Assembling contigs,Annotating contigs,
Cell identification,Generating clonotype)
Cell Filtration
Clonotypes Statistics
CDR3 Length Statistics
Display of VJ Gene Abundance for Each Sample
Clonotypes for Displaying VJ Gene Combinations
Analysis of Highly Expressed Clonotypes by Multi-Sample Comparison
Clone Proportion Analysis
Clonal Diversity Analysis

シーケンスおよび解析

表示されている推奨データ量および解析内容は参考値です。カスタマイズされたご要望については、 お問い合わせください 。

シーケンス
プラットフォーム
Illumina NovaSeq X-Plus Sequencing Platform
Read LengthPaired-end 150 bp
Recommended DataMinimum 20,000 read pairs/cell for gene expression; 5,000 read pairs/cell for V(D)J
AnalysisCell Ranger Analysis (Gene Expression)

Demultiplex BCL files from a sequencer into FASTQs.
Summary metrics (sequencing quality, number of cells detected, the mean reads per cell, and the median genes detected per cell et al.).
Alignment of reads to genome.
Gene expression quantification.
Clustering analysis.
Differentially expression analysis between clusters.
Visualization.
Standard Analysis (Gene Expression)

Demultiplex BCL files from a sequencer into FASTQs.
Alignment, UMI counting, Metrics summary.
Identification of highly variable gene (HVGs).
Cell Subpopulation Identification.
Principal component analysis (PCA).
Identify clusters of cells.
Dimensionality reduction and Visualization.
Marker gene detection (Differentially expression analysis between clusters).
GO/KEGG/Reactome Enrichment.
FunctionalAnnotation of Transcription Factor.
Protein-Protein Interaction Network Analysis.
Standard Analysis (V(D)J)

Demultiplex BCL files from a sequencer into FASTQs.
Construction of Immune Repertoire(Alignment,Assembling contigs,Annotating contigs,
Cell identification,Generating clonotype)
Cell Filtration
Clonotypes Statistics
CDR3 Length Statistics
Display of VJ Gene Abundance for Each Sample
Clonotypes for Displaying VJ Gene Combinations
Analysis of Highly Expressed Clonotypes by Multi-Sample Comparison
Clone Proportion Analysis
Clonal Diversity Analysis

シーケンスおよび解析

表示されている推奨データ量および解析内容は参考値です。カスタマイズされたご要望については、 お問い合わせください 。

シーケンス
プラットフォーム
Illumina NovaSeq X-Plus Sequencing Platform
Read LengthPaired-end 150 bp
Recommended DataMinimum 20,000 read pairs/cell for gene expression; 5,000 read pairs/cell for V(D)J
AnalysisCell Ranger Analysis (Gene Expression)

Demultiplex BCL files from a sequencer into FASTQs.
Summary metrics (sequencing quality, number of cells detected, the mean reads per cell, and the median genes detected per cell et al.).
Alignment of reads to genome.
Gene expression quantification.
Clustering analysis.
Differentially expression analysis between clusters.
Visualization.
Standard Analysis (Gene Expression)

Demultiplex BCL files from a sequencer into FASTQs.
Alignment, UMI counting, Metrics summary.
Identification of highly variable gene (HVGs).
Cell Subpopulation Identification.
Principal component analysis (PCA).
Identify clusters of cells.
Dimensionality reduction and Visualization.
Marker gene detection (Differentially expression analysis between clusters).
GO/KEGG/Reactome Enrichment.
FunctionalAnnotation of Transcription Factor.
Protein-Protein Interaction Network Analysis.
Standard Analysis (V(D)J)

Demultiplex BCL files from a sequencer into FASTQs.
Construction of Immune Repertoire(Alignment,Assembling contigs,Annotating contigs,
Cell identification,Generating clonotype)
Cell Filtration
Clonotypes Statistics
CDR3 Length Statistics
Display of VJ Gene Abundance for Each Sample
Clonotypes for Displaying VJ Gene Combinations
Analysis of Highly Expressed Clonotypes by Multi-Sample Comparison
Clone Proportion Analysis
Clonal Diversity Analysis

シーケンスおよび解析

表示されている推奨データ量および解析内容は参考値です。カスタマイズされたご要望については、 お問い合わせください 。

シーケンス
プラットフォーム
Illumina NovaSeq X-Plus Sequencing Platform
Read LengthPaired-end 150 bp
Recommended DataMinimum 20,000 read pairs/cell for gene expression; 5,000 read pairs/cell for V(D)J
AnalysisCell Ranger Analysis (Gene Expression)

Demultiplex BCL files from a sequencer into FASTQs.
Summary metrics (sequencing quality, number of cells detected, the mean reads per cell, and the median genes detected per cell et al.).
Alignment of reads to genome.
Gene expression quantification.
Clustering analysis.
Differentially expression analysis between clusters.
Visualization.
Standard Analysis (Gene Expression)

Demultiplex BCL files from a sequencer into FASTQs.
Alignment, UMI counting, Metrics summary.
Identification of highly variable gene (HVGs).
Cell Subpopulation Identification.
Principal component analysis (PCA).
Identify clusters of cells.
Dimensionality reduction and Visualization.
Marker gene detection (Differentially expression analysis between clusters).
GO/KEGG/Reactome Enrichment.
FunctionalAnnotation of Transcription Factor.
Protein-Protein Interaction Network Analysis.
Standard Analysis (V(D)J)

Demultiplex BCL files from a sequencer into FASTQs.
Construction of Immune Repertoire(Alignment,Assembling contigs,Annotating contigs,
Cell identification,Generating clonotype)
Cell Filtration
Clonotypes Statistics
CDR3 Length Statistics
Display of VJ Gene Abundance for Each Sample
Clonotypes for Displaying VJ Gene Combinations
Analysis of Highly Expressed Clonotypes by Multi-Sample Comparison
Clone Proportion Analysis
Clonal Diversity Analysis

解析例

Image
Image
1/1
CDR3長プロファイル

CDR3長のパターンを確認し、レパトアの特性評価およびサンプル比較をサポートします。


Image
Image
1/1
クロノタイプカウント

サンプルまたはグループ間でユニークなクロノタイプを比較し、免疫レパトアの多様性を探索します。

Image
Image
1/1
V遺伝子使用頻度

サンプル間のV遺伝子使用パターンを可視化し、T細胞レパトア内の受容体使用の違いを同定します。

Image
Image
1/1
クローン割合

サンプル間におけるクローン構造を評価するために、増殖したクローンタイプおよび低頻度クローンタイプの割合を比較します。

Image
Image
1/1
V-J遺伝子ペアリング

V-J遺伝子ペアリングの関係を可視化し、受容体再構成およびレパトア多様性の解釈をサポートします。

Image
Image
1/1
CDR3長プロファイル

CDR3長のパターンを確認し、レパトアの特性評価およびサンプル比較をサポートします。


Image
Image
1/1
クロノタイプカウント

サンプルまたはグループ間でユニークなクロノタイプを比較し、免疫レパトアの多様性を探索します。

Image
Image
1/1
V遺伝子使用頻度

サンプル間のV遺伝子使用パターンを可視化し、T細胞レパトア内の受容体使用の違いを同定します。

Image
Image
1/1
クローン割合

サンプル間におけるクローン構造を評価するために、増殖したクローンタイプおよび低頻度クローンタイプの割合を比較します。

Image
Image
1/1
V-J遺伝子ペアリング

V-J遺伝子ペアリングの関係を可視化し、受容体再構成およびレパトア多様性の解釈をサポートします。

解析例

Image
Image
1/1
CDR3長プロファイル

CDR3長のパターンを確認し、レパトアの特性評価およびサンプル比較をサポートします。


Image
Image
1/1
クロノタイプカウント

サンプルまたはグループ間でユニークなクロノタイプを比較し、免疫レパトアの多様性を探索します。

Image
Image
1/1
V遺伝子使用頻度

サンプル間のV遺伝子使用パターンを可視化し、T細胞レパトア内の受容体使用の違いを同定します。

Image
Image
1/1
クローン割合

サンプル間におけるクローン構造を評価するために、増殖したクローンタイプおよび低頻度クローンタイプの割合を比較します。

Image
Image
1/1
V-J遺伝子ペアリング

V-J遺伝子ペアリングの関係を可視化し、受容体再構成およびレパトア多様性の解釈をサポートします。

Image
Image
1/1
CDR3長プロファイル

CDR3長のパターンを確認し、レパトアの特性評価およびサンプル比較をサポートします。


Image
Image
1/1
クロノタイプカウント

サンプルまたはグループ間でユニークなクロノタイプを比較し、免疫レパトアの多様性を探索します。

Image
Image
1/1
V遺伝子使用頻度

サンプル間のV遺伝子使用パターンを可視化し、T細胞レパトア内の受容体使用の違いを同定します。

Image
Image
1/1
クローン割合

サンプル間におけるクローン構造を評価するために、増殖したクローンタイプおよび低頻度クローンタイプの割合を比較します。

Image
Image
1/1
V-J遺伝子ペアリング

V-J遺伝子ペアリングの関係を可視化し、受容体再構成およびレパトア多様性の解釈をサポートします。

その他のサービス

シングルセル遺伝子発現解析
(シングルセル遺伝子発現解析)
シングルセル遺伝子発現解析
(シングルセル遺伝子発現解析)
Visium HD 空間遺伝子発現
(Visium HD 空間遺伝子発現)
Visium HD 空間遺伝子発現
(Visium HD 空間遺伝子発現)
シングルセル・ロングリードトランスクリプトーム
(シングルセル・ロングリードトランスクリプトーム)
シングルセル・ロングリードトランスクリプトーム
(シングルセル・ロングリードトランスクリプトーム)

その他のサービス

シングルセル遺伝子発現解析
(シングルセル遺伝子発現解析)
シングルセル遺伝子発現解析
(シングルセル遺伝子発現解析)
Visium HD 空間遺伝子発現
(Visium HD 空間遺伝子発現)
Visium HD 空間遺伝子発現
(Visium HD 空間遺伝子発現)
シングルセル・ロングリードトランスクリプトーム
(シングルセル・ロングリードトランスクリプトーム)
シングルセル・ロングリードトランスクリプトーム
(シングルセル・ロングリードトランスクリプトーム)
Background
Background

プロジェクトを開始する準備はできていますか?

当社のプラットフォームは、

プロジェクト設計からデータ納品まで、お客様固有の実験ニーズに合わせたソリューションを提供し、シームレスな体験を実現します。


プライバシーポリシーCookieポリシーキャリア