
ノボジーン
  • ノボジーン
  • ゲノミクス
    • ヒト全ゲノムシーケンス
    • 動植物全ゲノムシーケンス
    • 微生物全ゲノムシーケンス
    • 動植物de novoシーケンス
    • 微生物de novoシーケンス
    • ショットガンメタゲノムシーケンス
    • アンプリコンシーケンス
    • 全エクソームシーケンス
    トランスクリプトミクス
    • mRNAシーケンス
    • トータルRNAシーケンス
    • 全長トランスクリプトームシーケンス
    • 全トランスクリプトームシーケンス
    • スモールRNAシーケンシング
    • 環状RNAシーケンス
    • メタトランスクリプトームシーケンス
    • 原核生物RNAシーケンス
    シングルセルと空間オミクス
    • シングルセル遺伝子発現解析
    • シングルセル免疫プロファイリングシーケンス
    • シングルセルロングリードトランスクリプトーム
    エピゲノミクス
    • 全ゲノムバイサルファイトシーケンス(WGBS)
    • ディレクトDNAメチレーションシーケンス(DM-Seq)new
    • 還元型バイサルファイトシーケンス (RRBS)
    • クロマチン免疫沈降シーケンス(ChIP-Seq)
    • RNA免疫沈降シーケンス (RIP-Seq)

    相乗りシーケンス

    • 相乗りシーケンス(イルミナプラットフォーム)
    • 相乗りシーケンス(PacBioプラットフォーム)
    プロテオミクス & メタボロミクス
    • Olinkプロテオミクス
  • プロモーションプロモーション
    • プラットフォーム
    • インテリジェント自動化プラットフォーム(Falcon)
    • バイオインフォマティクス解析ツール(NovoMagic)
    • カスタマサービスシステム(CSS)
    • パンフレット
    • ケーススタディ
    • ウェビナー
    • ブログ
    • サンプルガイドライン
    • コンミュニティ
    • がん研究
    • がん免疫
    • アグリゲノミクス
    • 環境
    • 食品科学
    • ヒトマイクロバイオーム
    • 植物および動物マイクロバイオーム
    • 創薬および開発
    • 希少および複雑性疾患
    • ノボジーンについて
    • 拠点一覧
    • ニュース
    • キャリア
  • お問い合わせお問い合わせ
  1. Home
  2. Resources
  3. ブログ
  4. GEO data mining (III) - Gene pathway enrichment analysis with complete code sharing

GEO data mining (III) - Gene pathway enrichment analysis with complete code sharing

The previous tutorials in our GEO data mining series have shared the steps of downloading data, “GEO Data Mining (I) “” and “” and the steps of gene variance analysis, “GEO Data Mining (II) – Differential gene expression analysis and visualization”. In this article, we will share code necessary for performing pathway enrichment analysis of the extracted genes whose differential expression has been examined.

Using the earlier tutorials, we have already identified differentially expressed genes. However, that information is not fully complete. Because there are many gene categories, the biological significance of a set of differentially expressed genes may not always be obvious. Enrichment analysis examines whether a set of genes is more significant at a certain functional node compared to a random level and extending from simple annotation of a single gene to the analysis of grouped ness of multiple gene sets. Enrichment analysis can be useful for annotating the function of genes of interest, such as differentially expressed genes, and analyzing which gene set they are most enriched in, and what types of regulation they are involved in, thus affecting the occurrence of diseases. The most common enrichment methods used today are Gene Ontology (GO) and KEGG (Kyoto Encyclopedia of Genes and Genomes) pathway enrichment analyses to reveal the biological context represented by a class of genes.

GO term functional enrichment analysis

The Gene Ontology (GO) database is one of the most widely used gene pathway annotation systems. Its principle is simply to calculate whether differential genes involved in regulatory processes are significantly clustered in three levels: cellular component (CC), molecular function (MF), and biological process (BP).

“Cellular component” describes a specific cellular structure whereby the gene product performs its function. For example, a product protein may be localized in the nucleus or in the ribosome. Molecular function describes the activity of the gene product at the molecular level, such as catalysis or transport. Biological process describes a biological function with which a gene product is associated, or a large biological activity accomplished by the activity of multiple molecules. Examples include mitosis or purine metabolism. The code below will help you perform GO on your sample.

##import related R package rm(list = ls()) load(“step4_output.Rdata”) library(clusterProfiler) library(dplyr) library(ggplot2) source(“kegg_plot_function.R”) #(1)input data gene_up = deg[deg$change == ‘up’,’ENTREZID’] gene_down = deg[deg$change == ‘down’,’ENTREZID’] gene_diff = c(gene_up,gene_down) gene_all = deg[,’ENTREZID’]

#(2) GO analysis, in three parts library(org.Hs.eg.db) if(T){ # Cellular component (CC) ego_CC <- enrichGO(gene = gene_diff, OrgDb= org.Hs.eg.db, ont = “CC”, pAdjustMethod = “BH”, minGSSize = 1, pvalueCutoff = 0.01, qvalueCutoff = 0.01, readable = TRUE) # Biological process (BP). ego_BP <- enrichGO(gene = gene_diff, OrgDb= org.Hs.eg.db, ont = “BP”, pAdjustMethod = “BH”, minGSSize = 1, pvalueCutoff = 0.01, qvalueCutoff = 0.01, readable = TRUE) # Molecular function (MF): ego_MF <- enrichGO(gene = gene_diff, OrgDb= org.Hs.eg.db, ont = “MF”, pAdjustMethod = “BH”, minGSSize = 1, pvalueCutoff = 0.01, qvalueCutoff = 0.01, readable = TRUE) save(ego_CC,ego_BP,ego_MF,file = “ego_GSE42872.Rdata”) } load(file = “ego_GSE42872.Rdata”)

#(3) Visualization #Strip Chart barplot(ego_CC,showCategory=20) #bubble plot dotplot(ego_CC) geneList = deg$logFC names(geneList)=deg$ENTREZID geneList = sort(geneList,decreasing = T) #(4) Demonstration of common genes in the top5 pathway #Gene-Concept Network cnetplot(ego_CC, categorySize=”pvalue”, foldChange=geneList,colorEdge = TRUE) cnetplot(ego_CC, foldChange=geneList, circular = TRUE, colorEdge = TRUE) #Enrichment Map emapplot(ego_CC) #(5) Demonstrate access relationships goplot(ego_CC) #(6)Heatmap-like functional classification heatplot(ego_CC,foldChange = geneList) pdf(“heatplot.pdf”,width = 14,height = 5) heatplot(ego_CC,foldChange = geneList) dev.off()
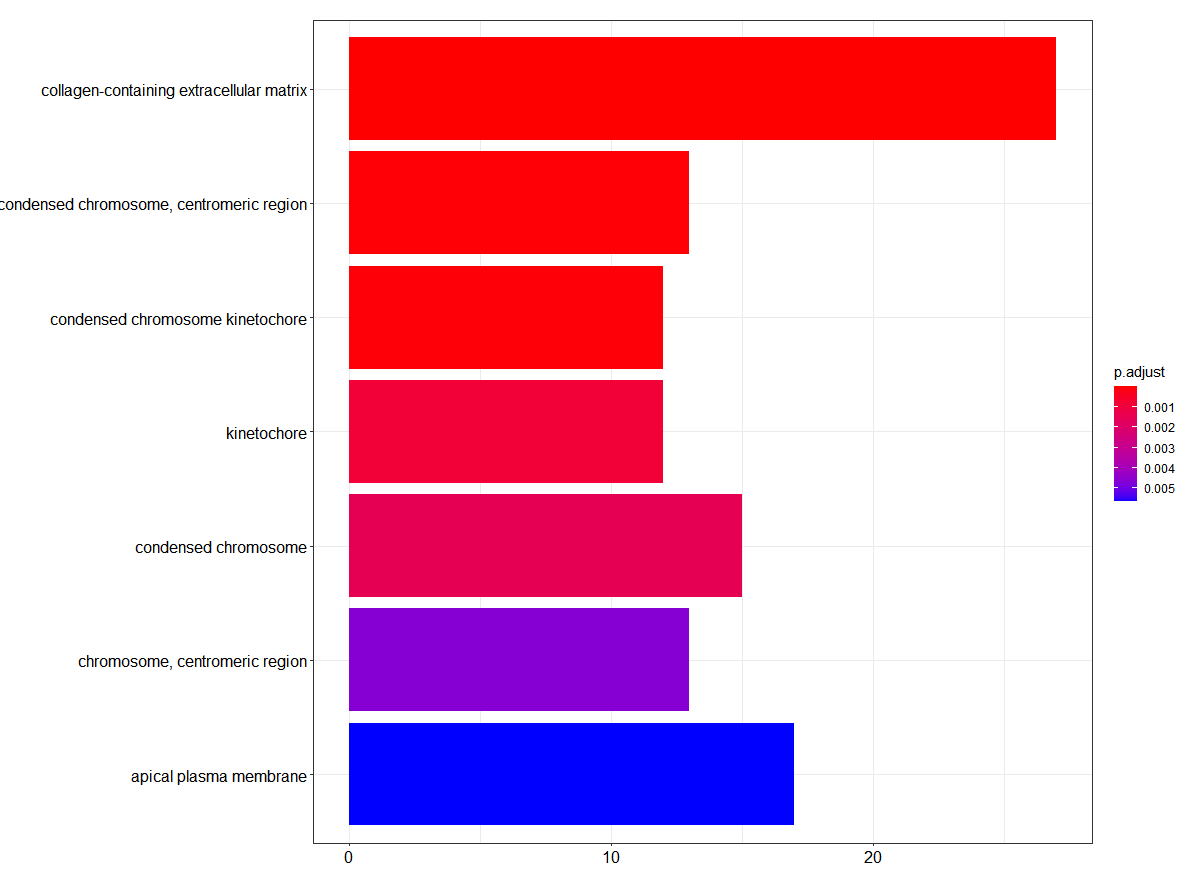
Histogram of GO Pathway enrichment analysis
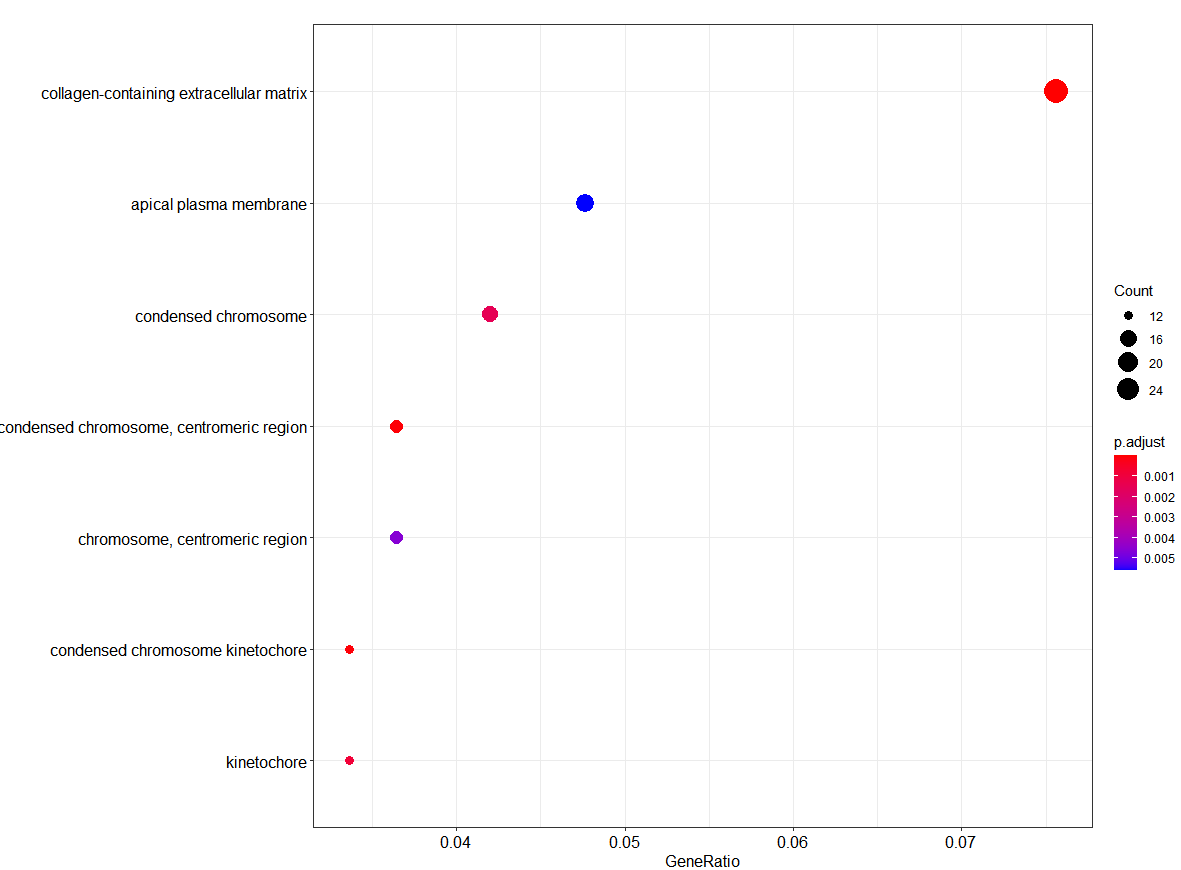
Bubble plot of GO Pathway enrichment analysis
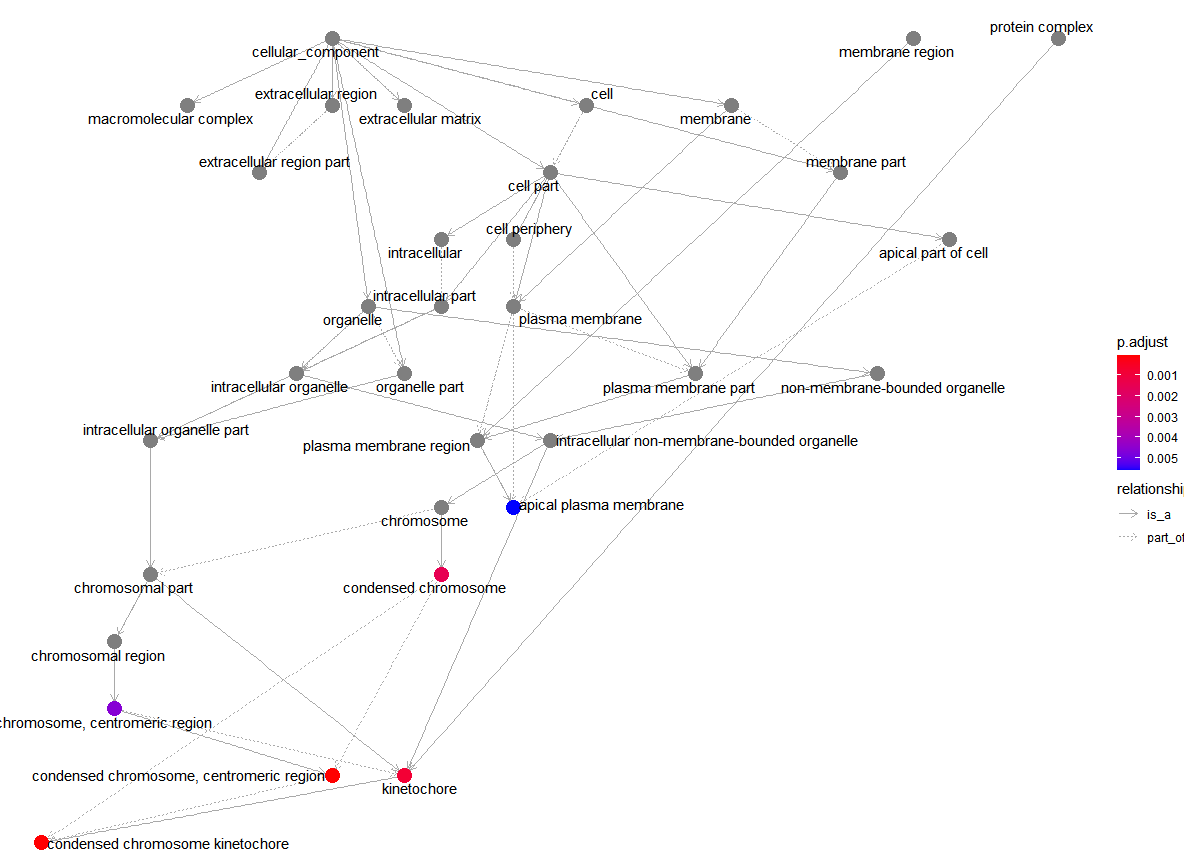
Access Relationships of GO Pathway enrichment analysis

KEGG enrichment analysis

KEGG pathway enrichment uses its own database for systematic analysis of gene function and genomic information, integrating information from genomics, biochemistry and systemic function, which helps us to study gene and expression information as a whole. Each KEGG pathway map contains a network of molecular interactions and reactions that link genes to pathways in gene products. Pathway analysis is useful for identifying the biological context of cellular and organismal metabolism as well as various other functions. The code below will help you perform GO on your sample.

#Up-regulation, down-regulation, difference, all genes #(1) Input data gene_up = deg[deg$change == ‘up’,’ENTREZID’] gene_down = deg[deg$change == ‘down’,’ENTREZID’] gene_diff = c(gene_up,gene_down) gene_all = deg[,’ENTREZID’]

#(2)Enrichment analysis of upregulated/downregulated/all differential genes if(T){ kk.up <- enrichKEGG(gene = gene_up, organism = ‘hsa’, universe = gene_all, pvalueCutoff = 0.9, qvalueCutoff = 0.9) kk.down <- enrichKEGG(gene = gene_down, organism = ‘hsa’, universe = gene_all, pvalueCutoff = 0.9, qvalueCutoff =0.9) kk.diff <- enrichKEGG(gene = gene_diff, organism = ‘hsa’, pvalueCutoff = 0.9) save(kk.diff,kk.down,kk.up,file = “GSE21933kegg.Rdata”) } load(“GSE21933kegg.Rdata”)

#(3) Extract the resulting data frame from the enrichment results kegg_diff_dt <- kk.diff@result

#(4) Filter pathways by pvalue down_kegg <- kk.down@result %>% filter(pvalue<0.05) %>% mutate(group=-1) up_kegg <- kk.up@result %>% filter(pvalue<0.05) %>% mutate(group=1)

#(5) Visualization g_kegg <- kegg_plot(up_kegg,down_kegg)

#g_kegg +scale_y_continuous(labels = c(20,15,10,5,0,5)) ggsave(g_kegg,filename = ‘kegg_up_down.png’)
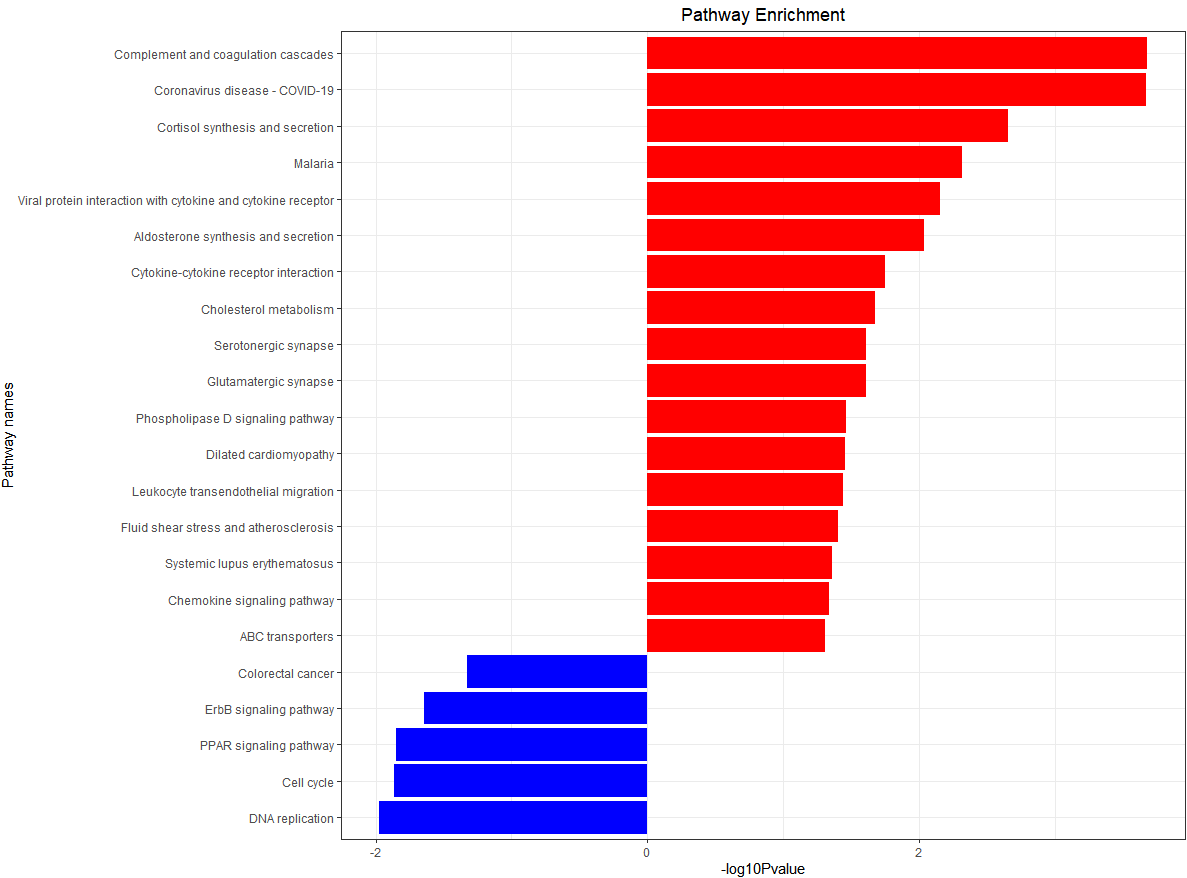
KEGG enrichment analysis histogram

Data mining of GEO database enables investigators to analyze differential expression, identify novel relationships or activities, extract significant conclusions, and build frameworks for new avenues of study. Investigators who are used to traditional work on coding genes can use the GEO datasets to enrich their studies with non-coding genes and explore DNA regulatory elements. If the sequencing depth from the GEO datasets is very deep, trans-shearing can be studied to mine potential circular RNAs. The original sequencing data can be analyzed from scratch to explore new genes. Therefore, data mining of GEO database enables investigators to explore gene functions and pathways expansively and in greater detail. The “GEO data mining” series has come to an end. In the future, we’ll produce more insightful series. Stay tuned!

サービスサービス menu

サポートサポート menu

会社会社 menu

サービス
全ゲノムシーケンスde novoシーケンスアンプリコンシーケンスショットガンメタゲノムシーケンスディレクトDNAメチレーションシーケンス(DM-Seq)mRNAシーケンスシングルセル遺伝子発現解析Olinkプロテオミクス
サポート
バイオインフォマティクス解析ツール(NovoMagic)カスタマサービスシステム(CSS)インテリジェント自動化プラットフォーム(Falcon)
会社
ノボジーンについて拠点一覧プラットフォームニュースキャリアお問い合わせ
YouTubeYouTube hoverXX hover
Copyright © 2026 Novogene Inc. All rights reserved. 本サービスは研究目的のみにご利用ください。臨床診断目的には使用頂けません。
ノボジーン
  • ノボジーン
  • ゲノミクス
    • ヒト全ゲノムシーケンス
    • 動植物全ゲノムシーケンス
    • 微生物全ゲノムシーケンス
    • 動植物de novoシーケンス
    • 微生物de novoシーケンス
    • ショットガンメタゲノムシーケンス
    • アンプリコンシーケンス
    • 全エクソームシーケンス
    トランスクリプトミクス
    • mRNAシーケンス
    • トータルRNAシーケンス
    • 全長トランスクリプトームシーケンス
    • 全トランスクリプトームシーケンス
    • スモールRNAシーケンシング
    • 環状RNAシーケンス
    • メタトランスクリプトームシーケンス
    • 原核生物RNAシーケンス
    シングルセルと空間オミクス
    • シングルセル遺伝子発現解析
    • シングルセル免疫プロファイリングシーケンス
    • シングルセルロングリードトランスクリプトーム
    エピゲノミクス
    • 全ゲノムバイサルファイトシーケンス(WGBS)
    • ディレクトDNAメチレーションシーケンス(DM-Seq)new
    • 還元型バイサルファイトシーケンス (RRBS)
    • クロマチン免疫沈降シーケンス(ChIP-Seq)
    • RNA免疫沈降シーケンス (RIP-Seq)

    相乗りシーケンス

    • 相乗りシーケンス(イルミナプラットフォーム)
    • 相乗りシーケンス(PacBioプラットフォーム)
    プロテオミクス & メタボロミクス
    • Olinkプロテオミクス
  • プロモーションプロモーション
    • プラットフォーム
    • インテリジェント自動化プラットフォーム(Falcon)
    • バイオインフォマティクス解析ツール(NovoMagic)
    • カスタマサービスシステム(CSS)
    • パンフレット
    • ケーススタディ
    • ウェビナー
    • ブログ
    • サンプルガイドライン
    • コンミュニティ
    • がん研究
    • がん免疫
    • アグリゲノミクス
    • 環境
    • 食品科学
    • ヒトマイクロバイオーム
    • 植物および動物マイクロバイオーム
    • 創薬および開発
    • 希少および複雑性疾患
    • ノボジーンについて
    • 拠点一覧
    • ニュース
    • キャリア
  • お問い合わせお問い合わせ
  1. Home
  2. Resources
  3. ブログ
  4. GEO data mining (III) - Gene pathway enrichment analysis with complete code sharing

GEO data mining (III) - Gene pathway enrichment analysis with complete code sharing

The previous tutorials in our GEO data mining series have shared the steps of downloading data, “GEO Data Mining (I) “” and “” and the steps of gene variance analysis, “GEO Data Mining (II) – Differential gene expression analysis and visualization”. In this article, we will share code necessary for performing pathway enrichment analysis of the extracted genes whose differential expression has been examined.

Using the earlier tutorials, we have already identified differentially expressed genes. However, that information is not fully complete. Because there are many gene categories, the biological significance of a set of differentially expressed genes may not always be obvious. Enrichment analysis examines whether a set of genes is more significant at a certain functional node compared to a random level and extending from simple annotation of a single gene to the analysis of grouped ness of multiple gene sets. Enrichment analysis can be useful for annotating the function of genes of interest, such as differentially expressed genes, and analyzing which gene set they are most enriched in, and what types of regulation they are involved in, thus affecting the occurrence of diseases. The most common enrichment methods used today are Gene Ontology (GO) and KEGG (Kyoto Encyclopedia of Genes and Genomes) pathway enrichment analyses to reveal the biological context represented by a class of genes.

GO term functional enrichment analysis

The Gene Ontology (GO) database is one of the most widely used gene pathway annotation systems. Its principle is simply to calculate whether differential genes involved in regulatory processes are significantly clustered in three levels: cellular component (CC), molecular function (MF), and biological process (BP).

“Cellular component” describes a specific cellular structure whereby the gene product performs its function. For example, a product protein may be localized in the nucleus or in the ribosome. Molecular function describes the activity of the gene product at the molecular level, such as catalysis or transport. Biological process describes a biological function with which a gene product is associated, or a large biological activity accomplished by the activity of multiple molecules. Examples include mitosis or purine metabolism. The code below will help you perform GO on your sample.

##import related R package rm(list = ls()) load(“step4_output.Rdata”) library(clusterProfiler) library(dplyr) library(ggplot2) source(“kegg_plot_function.R”) #(1)input data gene_up = deg[deg$change == ‘up’,’ENTREZID’] gene_down = deg[deg$change == ‘down’,’ENTREZID’] gene_diff = c(gene_up,gene_down) gene_all = deg[,’ENTREZID’]

#(2) GO analysis, in three parts library(org.Hs.eg.db) if(T){ # Cellular component (CC) ego_CC <- enrichGO(gene = gene_diff, OrgDb= org.Hs.eg.db, ont = “CC”, pAdjustMethod = “BH”, minGSSize = 1, pvalueCutoff = 0.01, qvalueCutoff = 0.01, readable = TRUE) # Biological process (BP). ego_BP <- enrichGO(gene = gene_diff, OrgDb= org.Hs.eg.db, ont = “BP”, pAdjustMethod = “BH”, minGSSize = 1, pvalueCutoff = 0.01, qvalueCutoff = 0.01, readable = TRUE) # Molecular function (MF): ego_MF <- enrichGO(gene = gene_diff, OrgDb= org.Hs.eg.db, ont = “MF”, pAdjustMethod = “BH”, minGSSize = 1, pvalueCutoff = 0.01, qvalueCutoff = 0.01, readable = TRUE) save(ego_CC,ego_BP,ego_MF,file = “ego_GSE42872.Rdata”) } load(file = “ego_GSE42872.Rdata”)

#(3) Visualization #Strip Chart barplot(ego_CC,showCategory=20) #bubble plot dotplot(ego_CC) geneList = deg$logFC names(geneList)=deg$ENTREZID geneList = sort(geneList,decreasing = T) #(4) Demonstration of common genes in the top5 pathway #Gene-Concept Network cnetplot(ego_CC, categorySize=”pvalue”, foldChange=geneList,colorEdge = TRUE) cnetplot(ego_CC, foldChange=geneList, circular = TRUE, colorEdge = TRUE) #Enrichment Map emapplot(ego_CC) #(5) Demonstrate access relationships goplot(ego_CC) #(6)Heatmap-like functional classification heatplot(ego_CC,foldChange = geneList) pdf(“heatplot.pdf”,width = 14,height = 5) heatplot(ego_CC,foldChange = geneList) dev.off()

Histogram of GO Pathway enrichment analysis

Bubble plot of GO Pathway enrichment analysis

Access Relationships of GO Pathway enrichment analysis

KEGG enrichment analysis

KEGG pathway enrichment uses its own database for systematic analysis of gene function and genomic information, integrating information from genomics, biochemistry and systemic function, which helps us to study gene and expression information as a whole. Each KEGG pathway map contains a network of molecular interactions and reactions that link genes to pathways in gene products. Pathway analysis is useful for identifying the biological context of cellular and organismal metabolism as well as various other functions. The code below will help you perform GO on your sample.

#Up-regulation, down-regulation, difference, all genes #(1) Input data gene_up = deg[deg$change == ‘up’,’ENTREZID’] gene_down = deg[deg$change == ‘down’,’ENTREZID’] gene_diff = c(gene_up,gene_down) gene_all = deg[,’ENTREZID’]

#(2)Enrichment analysis of upregulated/downregulated/all differential genes if(T){ kk.up <- enrichKEGG(gene = gene_up, organism = ‘hsa’, universe = gene_all, pvalueCutoff = 0.9, qvalueCutoff = 0.9) kk.down <- enrichKEGG(gene = gene_down, organism = ‘hsa’, universe = gene_all, pvalueCutoff = 0.9, qvalueCutoff =0.9) kk.diff <- enrichKEGG(gene = gene_diff, organism = ‘hsa’, pvalueCutoff = 0.9) save(kk.diff,kk.down,kk.up,file = “GSE21933kegg.Rdata”) } load(“GSE21933kegg.Rdata”)

#(3) Extract the resulting data frame from the enrichment results kegg_diff_dt <- kk.diff@result

#(4) Filter pathways by pvalue down_kegg <- kk.down@result %>% filter(pvalue<0.05) %>% mutate(group=-1) up_kegg <- kk.up@result %>% filter(pvalue<0.05) %>% mutate(group=1)

#(5) Visualization g_kegg <- kegg_plot(up_kegg,down_kegg)

#g_kegg +scale_y_continuous(labels = c(20,15,10,5,0,5)) ggsave(g_kegg,filename = ‘kegg_up_down.png’)

KEGG enrichment analysis histogram

Data mining of GEO database enables investigators to analyze differential expression, identify novel relationships or activities, extract significant conclusions, and build frameworks for new avenues of study. Investigators who are used to traditional work on coding genes can use the GEO datasets to enrich their studies with non-coding genes and explore DNA regulatory elements. If the sequencing depth from the GEO datasets is very deep, trans-shearing can be studied to mine potential circular RNAs. The original sequencing data can be analyzed from scratch to explore new genes. Therefore, data mining of GEO database enables investigators to explore gene functions and pathways expansively and in greater detail. The “GEO data mining” series has come to an end. In the future, we’ll produce more insightful series. Stay tuned!

サービスサービス menu

サポートサポート menu

会社会社 menu

サービス
全ゲノムシーケンスde novoシーケンスアンプリコンシーケンスショットガンメタゲノムシーケンスディレクトDNAメチレーションシーケンス(DM-Seq)mRNAシーケンスシングルセル遺伝子発現解析Olinkプロテオミクス
サポート
バイオインフォマティクス解析ツール(NovoMagic)カスタマサービスシステム(CSS)インテリジェント自動化プラットフォーム(Falcon)
会社
ノボジーンについて拠点一覧プラットフォームニュースキャリアお問い合わせ
YouTubeYouTube hoverXX hover
Copyright © 2026 Novogene Inc. All rights reserved. 本サービスは研究目的のみにご利用ください。臨床診断目的には使用頂けません。
プライバシーポリシーCookieポリシーキャリア