
ノボジーン
  • ノボジーン
  • ゲノミクス
    • ヒト全ゲノムシーケンス
    • 動植物全ゲノムシーケンス
    • 微生物全ゲノムシーケンス
    • 動植物de novoシーケンス
    • 微生物de novoシーケンス
    • ショットガンメタゲノムシーケンス
    • アンプリコンシーケンス
    • 全エクソームシーケンス
    トランスクリプトミクス
    • mRNAシーケンス
    • トータルRNAシーケンス
    • 全長トランスクリプトームシーケンス
    • 全トランスクリプトームシーケンス
    • スモールRNAシーケンシング
    • 環状RNAシーケンス
    • メタトランスクリプトームシーケンス
    • 原核生物RNAシーケンス
    シングルセルと空間オミクス
    • シングルセル遺伝子発現解析
    • シングルセル免疫プロファイリングシーケンス
    • シングルセルロングリードトランスクリプトーム
    エピゲノミクス
    • 全ゲノムバイサルファイトシーケンス(WGBS)
    • ディレクトDNAメチレーションシーケンス(DM-Seq)new
    • 還元型バイサルファイトシーケンス (RRBS)
    • クロマチン免疫沈降シーケンス(ChIP-Seq)
    • RNA免疫沈降シーケンス (RIP-Seq)

    相乗りシーケンス

    • 相乗りシーケンス(イルミナプラットフォーム)
    • 相乗りシーケンス(PacBioプラットフォーム)
    プロテオミクス & メタボロミクス
    • Olinkプロテオミクス
  • プロモーションプロモーション
    • プラットフォーム
    • インテリジェント自動化プラットフォーム(Falcon)
    • バイオインフォマティクス解析ツール(NovoMagic)
    • カスタマサービスシステム(CSS)
    • パンフレット
    • ケーススタディ
    • ウェビナー
    • ブログ
    • サンプルガイドライン
    • コンミュニティ
    • がん研究
    • がん免疫
    • アグリゲノミクス
    • 環境
    • 食品科学
    • ヒトマイクロバイオーム
    • 植物および動物マイクロバイオーム
    • 創薬および開発
    • 希少および複雑性疾患
    • ノボジーンについて
    • 拠点一覧
    • ニュース
    • キャリア
  • お問い合わせお問い合わせ
  1. Home
  2. Resources
  3. ブログ
  4. Achieving 98% Success Rate with Minimal 100 ng RNA Samples: A Comprehensive Look at Novogene’s Standard RNA-Seq Data

Achieving 98% Success Rate with Minimal 100 ng RNA Samples: A Comprehensive Look at Novogene’s Standard RNA-Seq Data

IntroductionOver the past decade, scientists have widely used Next-Generation Sequencing (NGS) technologies for transcriptomics. With RNA sequencing (RNA-seq), researchers can accurately measure and compare gene transcriptional levels. To assess the stability of Novogene’s library construction processes for low initial RNA inputs, Novogene conducted a series of experiments utilizing the human universal reference RNA standard (UHRR, Agilent p/n 740000). This standard, widely recognized for its consistency and reliability, provided a rigorous testing ground for Novogene’s methods.
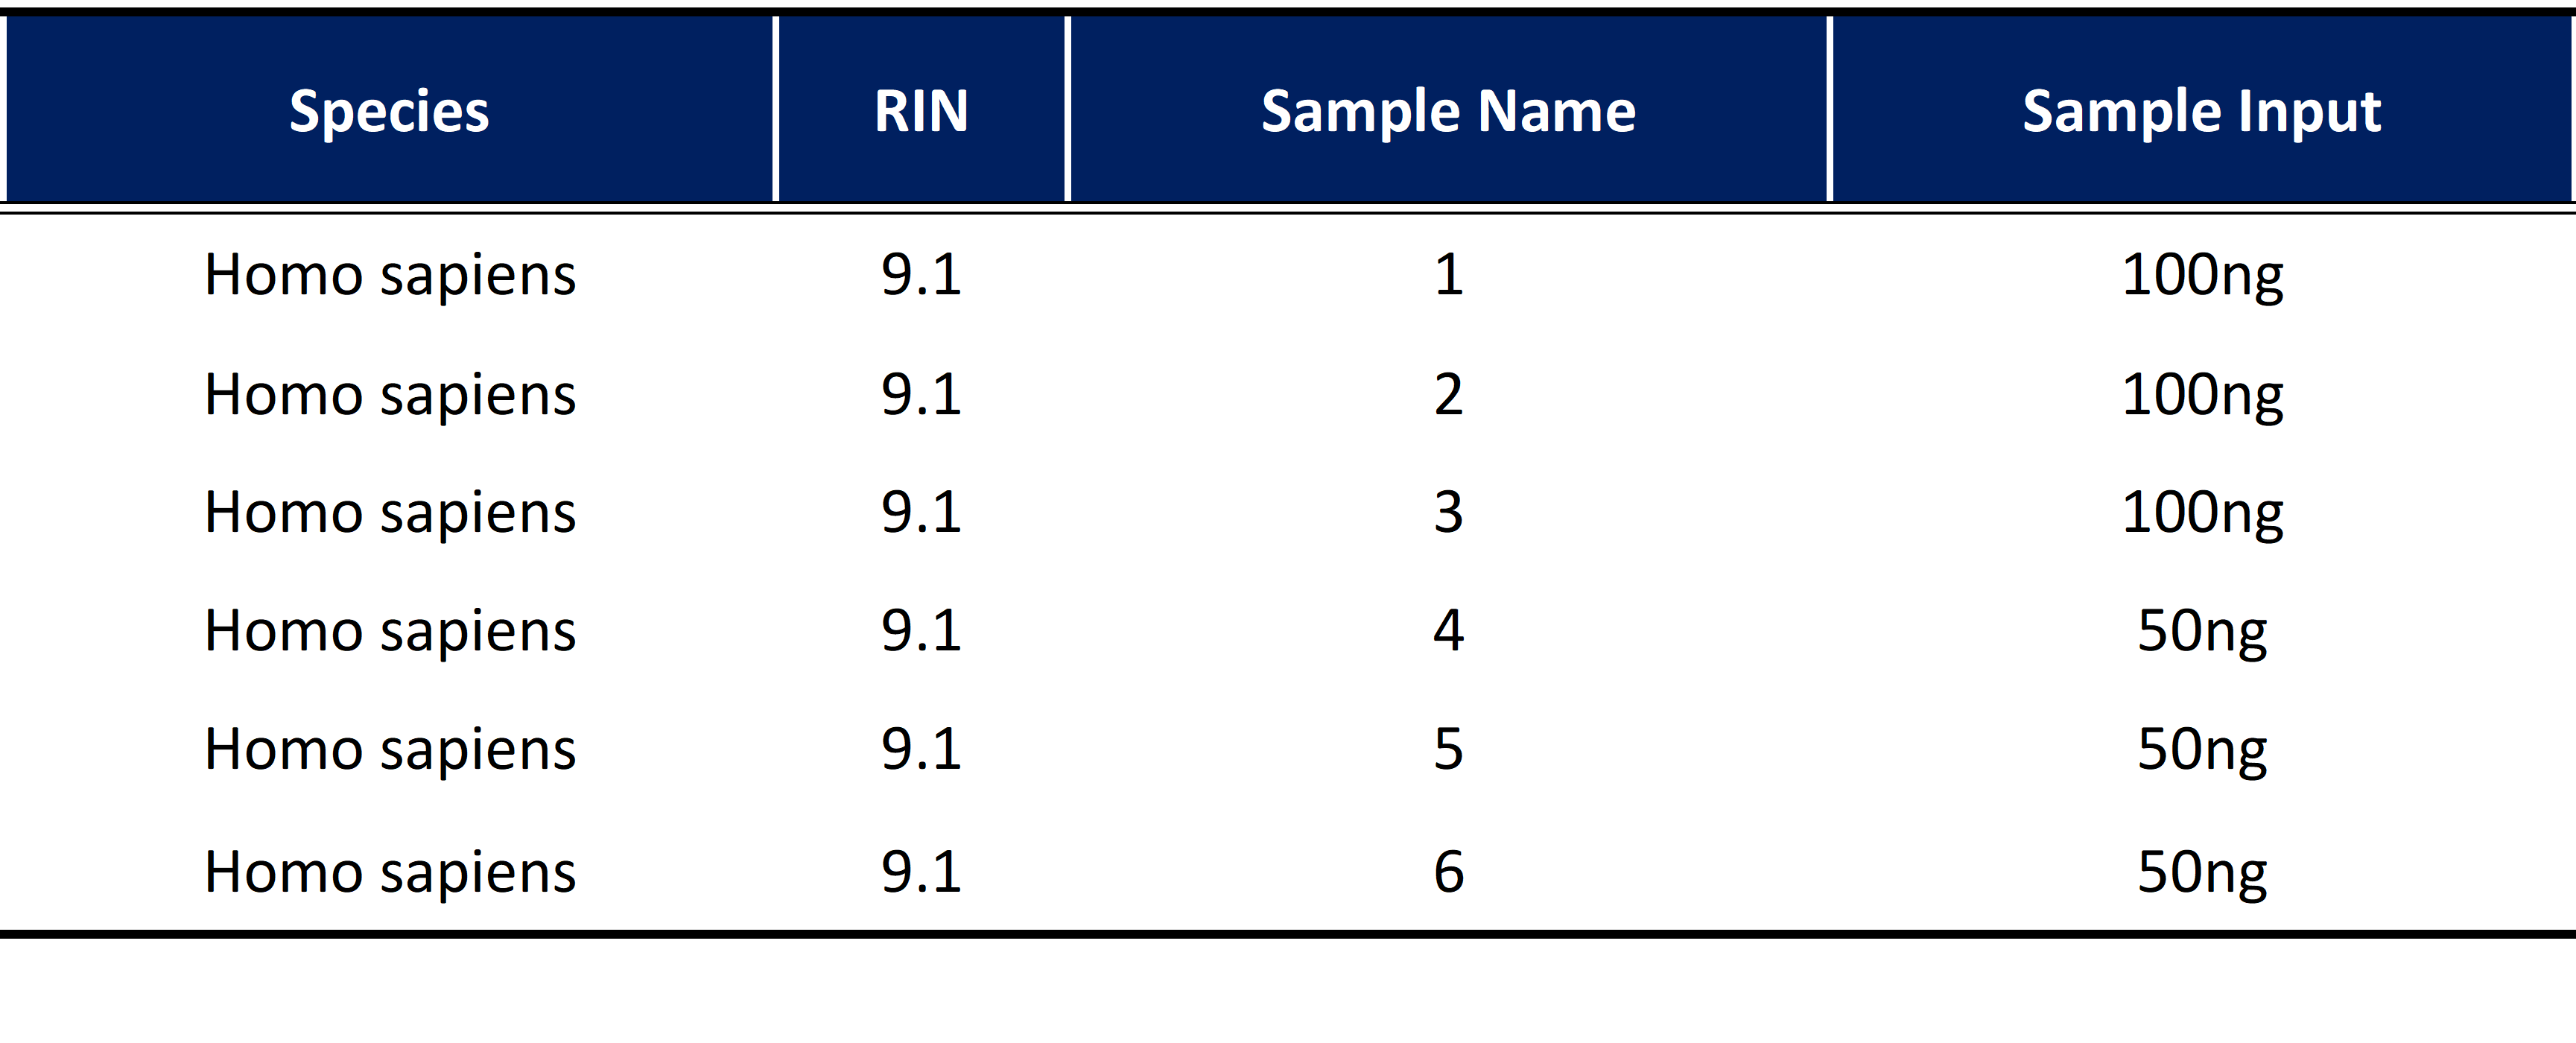
Experimental DesignThe Universal Human Reference RNA (UHRR) standard obtained from the same source was divided into six parts for the experiment (Table 1). Two groups were established, initiating with 50 ng and 100 ng, respectively. Each group consisted of three technical replicates. Short-read sequencing was employed using Illumina NovaSeq platform with paired-end 150bp (PE150) strategy, yielding 6 Gb of data per sample.

Table 1 | Sample information
Analysis Results1. Quality controlAfter preparing the library and sequencing the data, the raw data was filtered and checked for errors. The GC content was analyzed, and clean reads were then ready for further analysis. The sequencing data QC metrics reveals promising results.

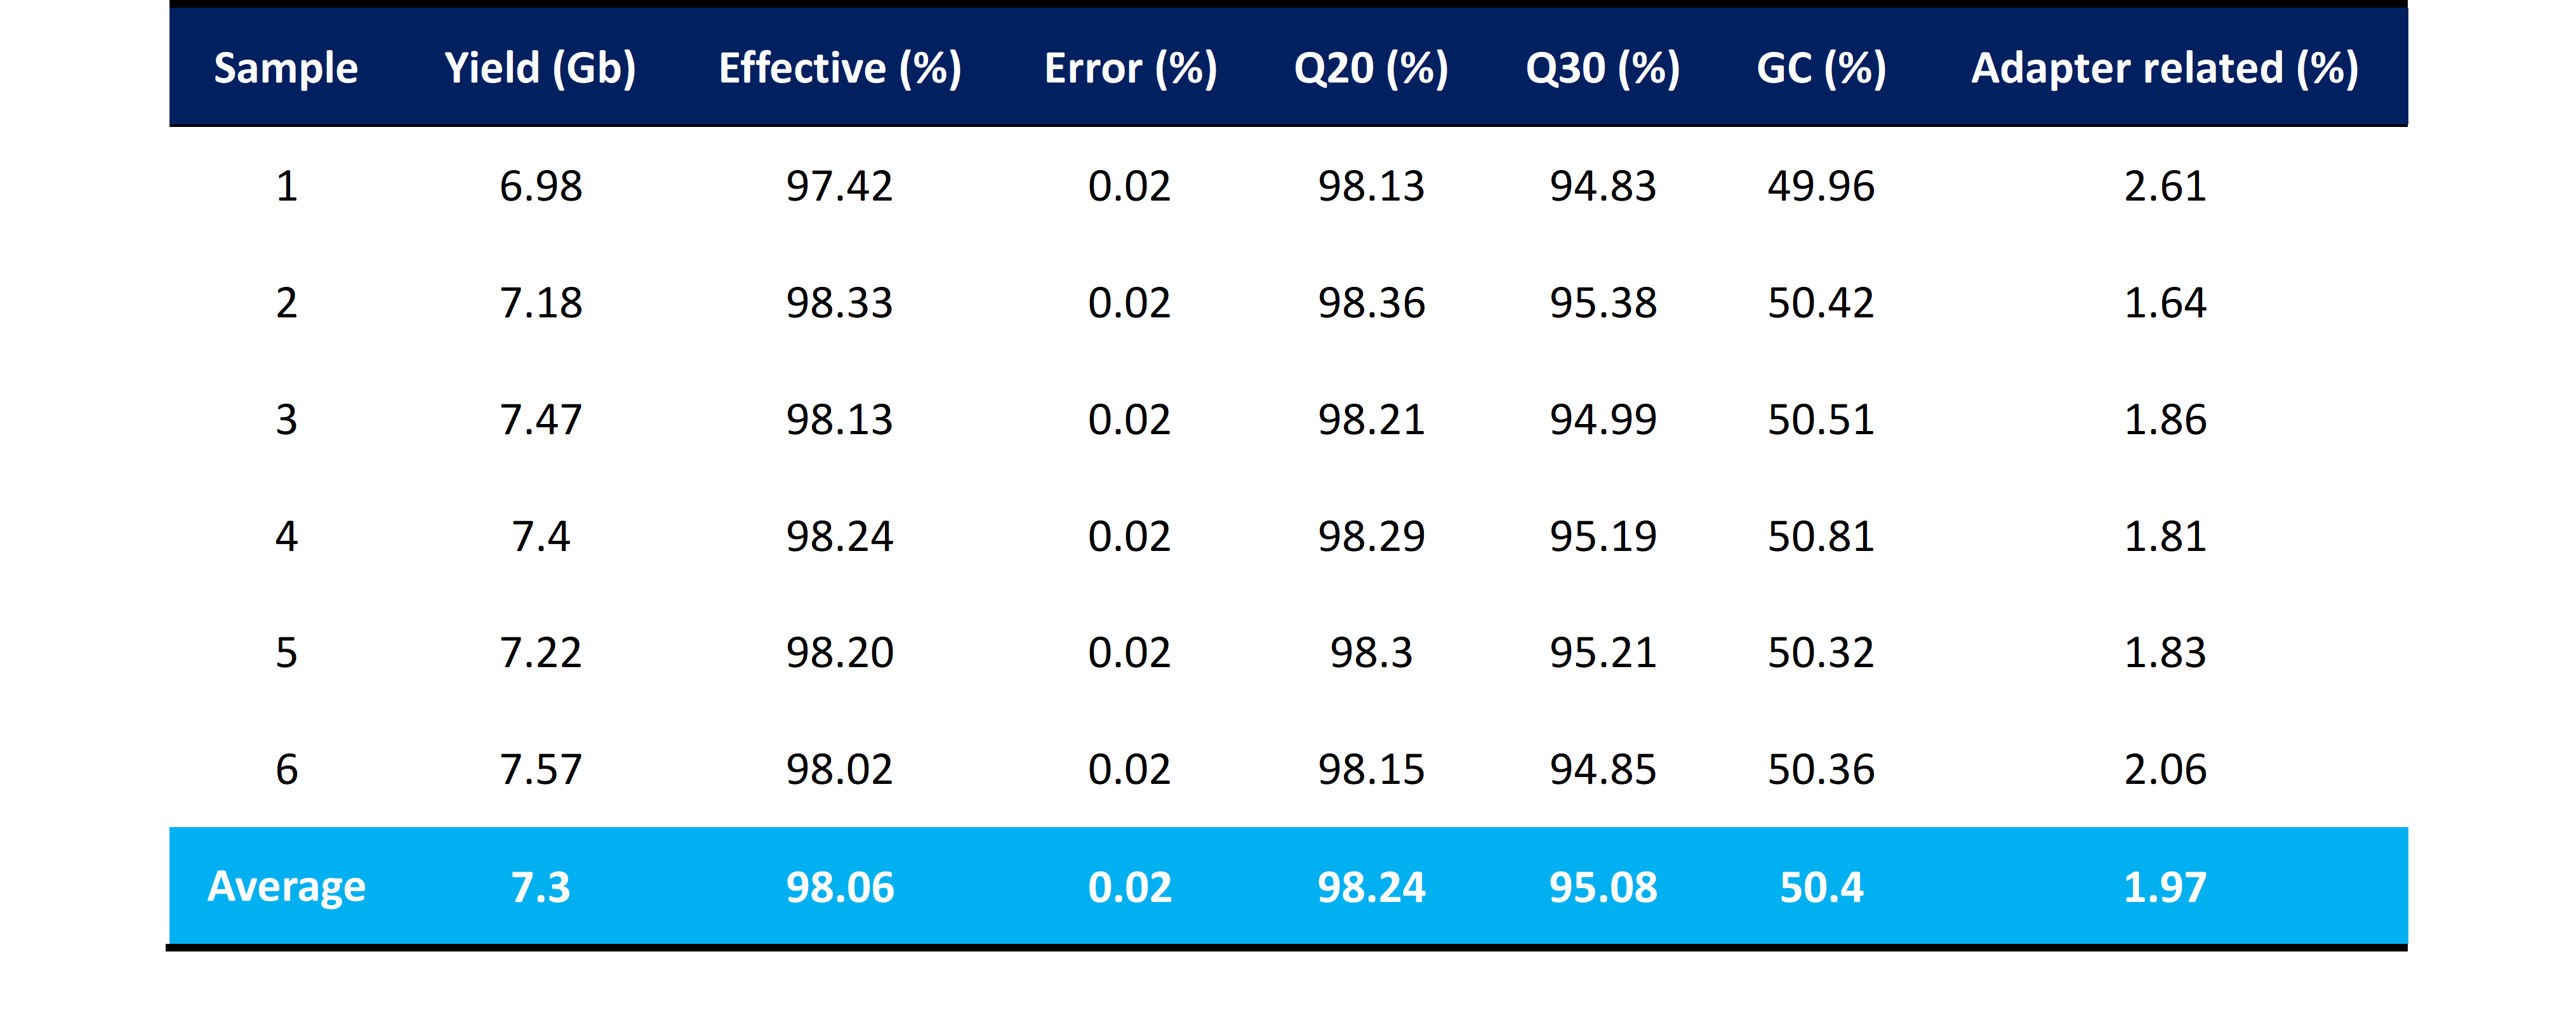
All six samples from the library were successfully retrieved with an exceptional effective rate exceeding 98%, the average Q20 and Q30 values of 98.24% and 95.08%, respectively, indicate a high accuracy of base calling and sequencing, further validating the quality of the obtained data. Notably, the average adapter percentage of only 1.97% demonstrates the efficiency of mapping reads to the reference genome. In summary, the QC metrics obtained in this experiment are comparable to those typically observed with normal RNA input amounts (Table 2).

Table 2 | Summary of quality control metrics
2

Effective rate: It represents the proportion of sequences that meet specific quality thresholds and are considered reliable for downstream analysis. Error rate: It is typically expressed as the proportion of bases that are incorrectly identified or sequenced compared to the total number of bases sequenced. Q20: Q20 represents 99% accuracy in the base call, or an error rate of 1 in 100. Q30: Q30 represents 99.9% accuracy in the base call, or an error rate of 1 in 1000.

2. AlignmentAfter quality control, the clean reads were aligned to the reference genome with HISAT2 software 2.For samples initially starting with a volume of 100 ng, the average total mapping rate was an impressive 91.04%, with a tight intra-group standard deviation of 0.24%. Furthermore, the average exon mapping rate for these samples was 90.57%, showing a high level of accuracy with a standard deviation of only 0.02% (Figure 1).

Similarly, samples with an initial volume of 50 ng exhibited an average total mapping rate of 91.77%, with an intra-group standard deviation of 0.11%. The average exon mapping rate for these samples was 90.69%, with a standard deviation of 0.20%.
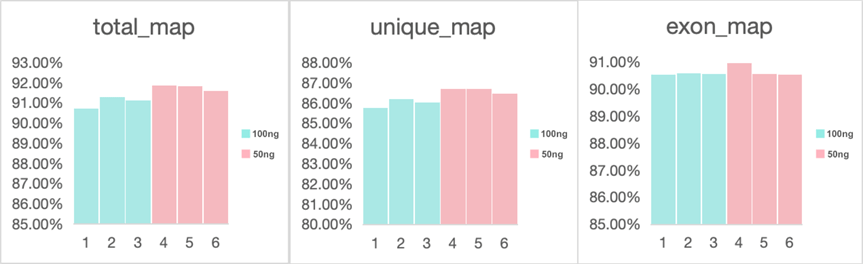
Figure 1. Mapping statistics of samples

3. Correlation analysisTo evaluate the relatedness of the samples, we performed gene expression correlation analysis. According to the Encode project, the square of the Pearson correlation coefficient (R²) should exceed 0.92 under ideal sampling and experimental conditions. Conversely, a low correlation score for certain samples may indicate the presence of poorly sequenced or outlier data 3.

We computed correlation coefficients for gene expression using normalized gene counts (measured in Fragments Per Kilobase of transcript per Million mapped reads, FPKM) within both intra-group and inter-group samples. Subsequently, we generated a heatmap to visually highlight differences between groups and the consistency within intra-group samples (Figure 2). The repeated correlation of measured data within the same RNA inputs group and the concordance across different starting inputs exceeded 0.97, indicating robust reproducibility and lack of any technical outliers.
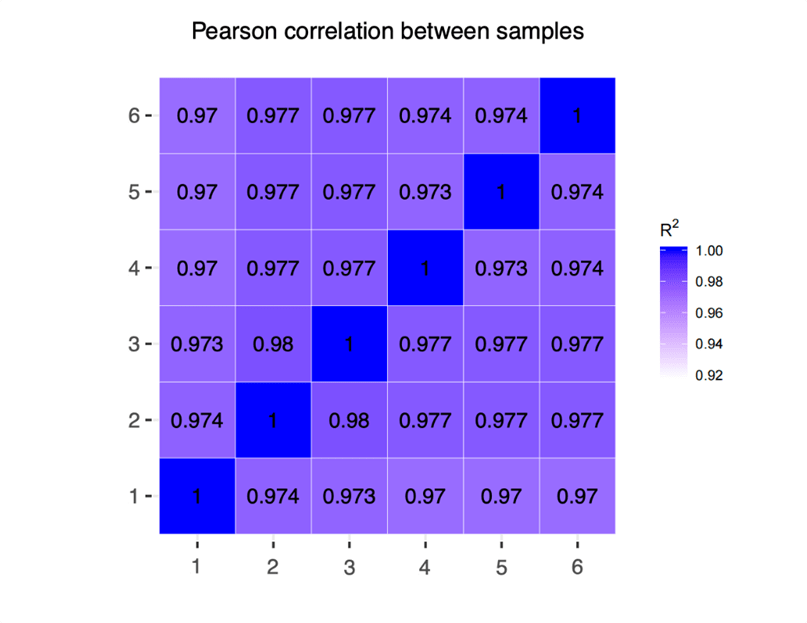
Figure 2. Heatmap of intra-group and inter-group samples

Novogene’s AdvantagesNovogene boasts extensive expertise in transcriptome sequencing projects and sample processing, having successfully conducted reference transcriptome sequencing analyses on numerous species, including humans, mice, rats, rice, Arabidopsis, tomatoes, peanuts, cotton, cucumbers, wheat, and biomedically crucial materials such as tumor cells (subcutaneous tumors), tumor-infiltrating lymphocytes, and bone marrow, among others.

The measured data from Novogene showcased a stable library construction process, robust capacity, and a high success rate for transcriptome sequencing with low starting input samples (50 ng and 100 ng). With Novogene’s expertise, your most challenging samples become opportunities to uncover valuable insights and make significant strides in your research.

Reference
  1. Adiconis X, Borges-Rivera D, Satija R, et al. Comparative analysis of RNA sequencing methods for degraded or low-input samples [published correction appears in Nat Methods. 2014 Feb;11(2):210]. Nat Methods.2013;10(7):623-629. doi:10.1038/nmeth.2483
  2. Mortazavi, A., Williams, B., McCue, K. et al. Mapping and quantifying mammalian transcriptomes by RNA-Seq.Nat Methods 5, 621–628 (2008). https://doi.org/10.1038/nmeth.1226
  3. ENCODE Project Consortium The ENCODE (ENCyclopedia of DNA elements) project. Science.2004;306(5696):636–640.

サービスサービス menu

サポートサポート menu

会社会社 menu

サービス
全ゲノムシーケンスde novoシーケンスアンプリコンシーケンスショットガンメタゲノムシーケンスディレクトDNAメチレーションシーケンス(DM-Seq)mRNAシーケンスシングルセル遺伝子発現解析Olinkプロテオミクス
サポート
バイオインフォマティクス解析ツール(NovoMagic)カスタマサービスシステム(CSS)インテリジェント自動化プラットフォーム(Falcon)
会社
ノボジーンについて拠点一覧プラットフォームニュースキャリアお問い合わせ
YouTubeYouTube hoverXX hover
Copyright © 2026 Novogene Inc. All rights reserved. 本サービスは研究目的のみにご利用ください。臨床診断目的には使用頂けません。
ノボジーン
  • ノボジーン
  • ゲノミクス
    • ヒト全ゲノムシーケンス
    • 動植物全ゲノムシーケンス
    • 微生物全ゲノムシーケンス
    • 動植物de novoシーケンス
    • 微生物de novoシーケンス
    • ショットガンメタゲノムシーケンス
    • アンプリコンシーケンス
    • 全エクソームシーケンス
    トランスクリプトミクス
    • mRNAシーケンス
    • トータルRNAシーケンス
    • 全長トランスクリプトームシーケンス
    • 全トランスクリプトームシーケンス
    • スモールRNAシーケンシング
    • 環状RNAシーケンス
    • メタトランスクリプトームシーケンス
    • 原核生物RNAシーケンス
    シングルセルと空間オミクス
    • シングルセル遺伝子発現解析
    • シングルセル免疫プロファイリングシーケンス
    • シングルセルロングリードトランスクリプトーム
    エピゲノミクス
    • 全ゲノムバイサルファイトシーケンス(WGBS)
    • ディレクトDNAメチレーションシーケンス(DM-Seq)new
    • 還元型バイサルファイトシーケンス (RRBS)
    • クロマチン免疫沈降シーケンス(ChIP-Seq)
    • RNA免疫沈降シーケンス (RIP-Seq)

    相乗りシーケンス

    • 相乗りシーケンス(イルミナプラットフォーム)
    • 相乗りシーケンス(PacBioプラットフォーム)
    プロテオミクス & メタボロミクス
    • Olinkプロテオミクス
  • プロモーションプロモーション
    • プラットフォーム
    • インテリジェント自動化プラットフォーム(Falcon)
    • バイオインフォマティクス解析ツール(NovoMagic)
    • カスタマサービスシステム(CSS)
    • パンフレット
    • ケーススタディ
    • ウェビナー
    • ブログ
    • サンプルガイドライン
    • コンミュニティ
    • がん研究
    • がん免疫
    • アグリゲノミクス
    • 環境
    • 食品科学
    • ヒトマイクロバイオーム
    • 植物および動物マイクロバイオーム
    • 創薬および開発
    • 希少および複雑性疾患
    • ノボジーンについて
    • 拠点一覧
    • ニュース
    • キャリア
  • お問い合わせお問い合わせ
  1. Home
  2. Resources
  3. ブログ
  4. Achieving 98% Success Rate with Minimal 100 ng RNA Samples: A Comprehensive Look at Novogene’s Standard RNA-Seq Data

Achieving 98% Success Rate with Minimal 100 ng RNA Samples: A Comprehensive Look at Novogene’s Standard RNA-Seq Data

IntroductionOver the past decade, scientists have widely used Next-Generation Sequencing (NGS) technologies for transcriptomics. With RNA sequencing (RNA-seq), researchers can accurately measure and compare gene transcriptional levels. To assess the stability of Novogene’s library construction processes for low initial RNA inputs, Novogene conducted a series of experiments utilizing the human universal reference RNA standard (UHRR, Agilent p/n 740000). This standard, widely recognized for its consistency and reliability, provided a rigorous testing ground for Novogene’s methods.

Experimental DesignThe Universal Human Reference RNA (UHRR) standard obtained from the same source was divided into six parts for the experiment (Table 1). Two groups were established, initiating with 50 ng and 100 ng, respectively. Each group consisted of three technical replicates. Short-read sequencing was employed using Illumina NovaSeq platform with paired-end 150bp (PE150) strategy, yielding 6 Gb of data per sample.

Table 1 | Sample information

Analysis Results1. Quality controlAfter preparing the library and sequencing the data, the raw data was filtered and checked for errors. The GC content was analyzed, and clean reads were then ready for further analysis. The sequencing data QC metrics reveals promising results.

All six samples from the library were successfully retrieved with an exceptional effective rate exceeding 98%, the average Q20 and Q30 values of 98.24% and 95.08%, respectively, indicate a high accuracy of base calling and sequencing, further validating the quality of the obtained data. Notably, the average adapter percentage of only 1.97% demonstrates the efficiency of mapping reads to the reference genome. In summary, the QC metrics obtained in this experiment are comparable to those typically observed with normal RNA input amounts (Table 2).

Table 2 | Summary of quality control metrics

2

Effective rate: It represents the proportion of sequences that meet specific quality thresholds and are considered reliable for downstream analysis. Error rate: It is typically expressed as the proportion of bases that are incorrectly identified or sequenced compared to the total number of bases sequenced. Q20: Q20 represents 99% accuracy in the base call, or an error rate of 1 in 100. Q30: Q30 represents 99.9% accuracy in the base call, or an error rate of 1 in 1000.

2. AlignmentAfter quality control, the clean reads were aligned to the reference genome with HISAT2 software 2.For samples initially starting with a volume of 100 ng, the average total mapping rate was an impressive 91.04%, with a tight intra-group standard deviation of 0.24%. Furthermore, the average exon mapping rate for these samples was 90.57%, showing a high level of accuracy with a standard deviation of only 0.02% (Figure 1).

Similarly, samples with an initial volume of 50 ng exhibited an average total mapping rate of 91.77%, with an intra-group standard deviation of 0.11%. The average exon mapping rate for these samples was 90.69%, with a standard deviation of 0.20%.

Figure 1. Mapping statistics of samples

3. Correlation analysisTo evaluate the relatedness of the samples, we performed gene expression correlation analysis. According to the Encode project, the square of the Pearson correlation coefficient (R²) should exceed 0.92 under ideal sampling and experimental conditions. Conversely, a low correlation score for certain samples may indicate the presence of poorly sequenced or outlier data 3.

We computed correlation coefficients for gene expression using normalized gene counts (measured in Fragments Per Kilobase of transcript per Million mapped reads, FPKM) within both intra-group and inter-group samples. Subsequently, we generated a heatmap to visually highlight differences between groups and the consistency within intra-group samples (Figure 2). The repeated correlation of measured data within the same RNA inputs group and the concordance across different starting inputs exceeded 0.97, indicating robust reproducibility and lack of any technical outliers.

Figure 2. Heatmap of intra-group and inter-group samples

Novogene’s AdvantagesNovogene boasts extensive expertise in transcriptome sequencing projects and sample processing, having successfully conducted reference transcriptome sequencing analyses on numerous species, including humans, mice, rats, rice, Arabidopsis, tomatoes, peanuts, cotton, cucumbers, wheat, and biomedically crucial materials such as tumor cells (subcutaneous tumors), tumor-infiltrating lymphocytes, and bone marrow, among others.

The measured data from Novogene showcased a stable library construction process, robust capacity, and a high success rate for transcriptome sequencing with low starting input samples (50 ng and 100 ng). With Novogene’s expertise, your most challenging samples become opportunities to uncover valuable insights and make significant strides in your research.

Reference
  1. Adiconis X, Borges-Rivera D, Satija R, et al. Comparative analysis of RNA sequencing methods for degraded or low-input samples [published correction appears in Nat Methods. 2014 Feb;11(2):210]. Nat Methods.2013;10(7):623-629. doi:10.1038/nmeth.2483
  2. Mortazavi, A., Williams, B., McCue, K. et al. Mapping and quantifying mammalian transcriptomes by RNA-Seq.Nat Methods 5, 621–628 (2008). https://doi.org/10.1038/nmeth.1226
  3. ENCODE Project Consortium The ENCODE (ENCyclopedia of DNA elements) project. Science.2004;306(5696):636–640.

サービスサービス menu

サポートサポート menu

会社会社 menu

サービス
全ゲノムシーケンスde novoシーケンスアンプリコンシーケンスショットガンメタゲノムシーケンスディレクトDNAメチレーションシーケンス(DM-Seq)mRNAシーケンスシングルセル遺伝子発現解析Olinkプロテオミクス
サポート
バイオインフォマティクス解析ツール(NovoMagic)カスタマサービスシステム(CSS)インテリジェント自動化プラットフォーム(Falcon)
会社
ノボジーンについて拠点一覧プラットフォームニュースキャリアお問い合わせ
YouTubeYouTube hoverXX hover
Copyright © 2026 Novogene Inc. All rights reserved. 本サービスは研究目的のみにご利用ください。臨床診断目的には使用頂けません。
プライバシーポリシーCookieポリシーキャリア